Remote sensing is one of the most powerful applications of GIS. With the rise of open-source tools, QGIS has become a popular platform for remote sensing professionals. But to get the most out of it, you need the right plugins. In this article, we’ve compiled the Top 10 Best QGIS Plugins for Remote Sensing in 2025 that will supercharge your geospatial analysis and help you extract valuable insights from satellite imagery.
Top 10 Best QGIS Plugins for Remote Sensing

1. Semi-Automatic Classification Plugin (SCP)
Best For: Land cover classification, NDVI analysis, and satellite image preprocessing
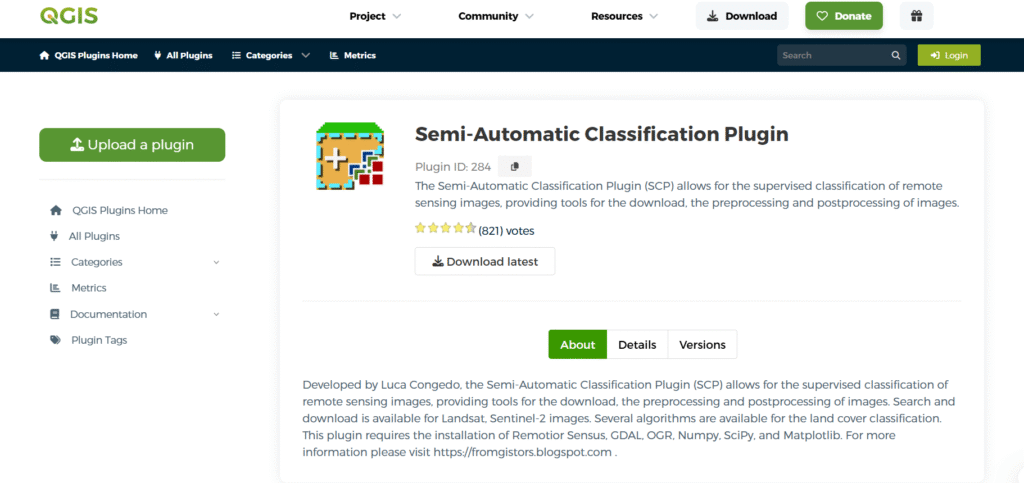
The Semi-Automatic Classification Plugin (SCP) is widely regarded as the most powerful and popular plugin in QGIS for remote sensing tasks. It transforms QGIS into a fully functional remote sensing workstation, making it ideal for professionals, researchers, and students working with satellite imagery.
🔍 Key Features:
✅ Multi-sensor Support
SCP supports a wide range of satellite sensors, including:
-
Landsat (4–9)
-
Sentinel-2 (from ESA)
-
ASTER
-
MODIS, Sentinel-3, and many others
You can easily download satellite images directly through the plugin, streamlining your workflow.
✅ Supervised and Unsupervised Classification
SCP allows both supervised (user-defined training samples) and unsupervised (automated clustering) classification. This means you can:
-
Classify land cover types like water, vegetation, urban, etc.
-
Use training areas for accurate mapping
-
Create thematic maps for research and analysis
✅ Band Calculation (NDVI, NDWI, etc.)
The plugin provides built-in tools for computing vegetation and water indices, such as:
-
NDVI (Normalized Difference Vegetation Index)
-
NDWI (Normalized Difference Water Index)
-
SAVI, EVI, and more
These indices are crucial for analyzing vegetation health, water bodies, and other land surface features.
✅ Preprocessing Tools
SCP comes with a suite of tools for preparing your satellite images before analysis:
-
Atmospheric correction using DOS1 (Dark Object Subtraction)
-
Band alignment and resampling for multi-sensor image stacking
-
Conversion of DN to reflectance or radiance values
This ensures that your data is clean, calibrated, and ready for accurate analysis.
✅ Download and Integration
-
Easily installable via the QGIS Plugin Manager
-
Integrates seamlessly with other QGIS raster tools
-
Offers tutorials and documentation directly within the plugin
2. Orfeo Toolbox (OTB)
Best For: Advanced image analysis, segmentation, and large-scale raster data processing
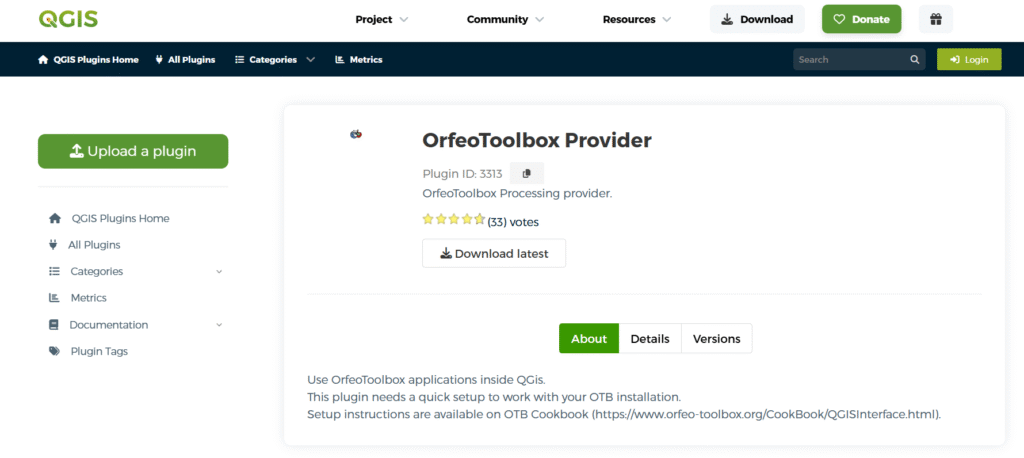
Orfeo Toolbox (OTB) is an open-source library designed for processing high-resolution remote sensing images. Originally developed by the French Space Agency (CNES), OTB is now a trusted solution for handling object-based image analysis (OBIA) and feature extraction. It integrates seamlessly with QGIS through the Processing Toolbox, giving you access to a powerful suite of remote sensing tools.
🔍 Key Features:
✅ Object-Based Image Analysis (OBIA)
Unlike traditional pixel-based classification, OTB supports object-based classification, where:
-
Images are segmented into meaningful regions or “objects”
-
Classification is performed based on texture, shape, and spectral information
-
Ideal for high-resolution satellite data like SPOT, Pleiades, or commercial sensors
This method improves accuracy in urban studies, land use mapping, and detailed ecological monitoring.
✅ Feature Extraction and Classification
OTB includes algorithms to extract and classify features such as:
-
Roads, buildings, vegetation patches, and water bodies
-
Automatically calculate statistical and texture-based attributes
-
Support for supervised and unsupervised classification, including SVM and K-means
This makes it ideal for detecting changes in land use, mapping infrastructure, or tracking environmental impacts.
✅ Handles Very Large Raster Files
OTB is optimized for processing large remote sensing images—even those several gigabytes in size. It supports:
-
Tiling
-
Streaming
-
On-the-fly memory management
You won’t face crashes or slow-downs when working with high-resolution or multi-temporal datasets.
✅ Optical and Radar Image Processing
OTB supports a wide variety of image types, including:
-
Optical imagery (Sentinel-2, Landsat, SPOT)
-
Radar imagery (Sentinel-1, SAR data)
It also includes advanced SAR processing capabilities like speckle filtering, coherence analysis, and polarimetric decomposition.
🧩 Integration in QGIS
-
Fully accessible via QGIS’s Processing Toolbox
-
You can run OTB algorithms directly from the QGIS interface
-
Offers advanced options through command-line and standalone tools
3. Google Earth Engine (GEE) Plugin for QGIS
Best For: Accessing and processing cloud-based satellite data effortlessly within QGIS

The Google Earth Engine (GEE) Plugin bridges the power of Google’s cloud-based geospatial processing platform with the versatility of QGIS. It allows users to tap into the massive satellite data archive of Earth Engine directly from the QGIS interface—making it a favorite tool for researchers, environmental scientists, and remote sensing professionals.
🔍 Key Features:
✅ Visualize and Access Remote Sensing Datasets
With GEE’s plugin, you can browse and load:
-
Global satellite imagery (Sentinel-2, Landsat, MODIS, etc.)
-
Environmental datasets (precipitation, land surface temperature, vegetation indices, etc.)
-
Long-term time series data with ease
The plugin makes it easy to overlay and compare datasets instantly on your QGIS map canvas.
✅ Run Earth Engine Scripts Inside QGIS
Once connected to your GEE account, you can:
-
Write or import JavaScript-based Earth Engine scripts
-
Execute them directly from QGIS
-
View outputs like NDVI maps, land cover classifications, or temporal analyses
You get the power of Google’s cloud-based computation without ever leaving the QGIS environment.
✅ Export Results with a Few Clicks
The plugin allows you to:
-
Export analysis outputs (raster or vector) directly from GEE to your local machine or Google Drive
-
Save processed layers as GeoTIFF, SHP, or CSV
-
Use results seamlessly within your ongoing QGIS project
This is a huge time-saver when working on large or multi-sensor datasets.
✅ Seamless Integration with GEE Data Catalog
You get direct access to:
-
More than 70+ petabytes of Earth observation data
-
Thousands of pre-processed, ready-to-use datasets
-
Datasets updated in near real-time (e.g., Sentinel-2 every 5 days)
This makes it extremely useful for:
-
Deforestation monitoring
-
Agricultural analysis
-
Climate change tracking
-
Urban expansion mapping
⚙️ Requirements
-
A Google Earth Engine account (free for research and non-commercial use)
-
An active internet connection
-
Basic knowledge of JavaScript-based GEE scripting is helpful but not mandatory
Related Content:
7 Powerful GIS Applications in Climate Science
25 Best QGIS Plugins Every QGIS User Must Know
Top 16 FREE Sources of GIS Vector Data (Updated 2025)
4. Sentinel Hub Plugin
Best For: Accessing Sentinel-2, MODIS, and Landsat imagery directly in QGIS
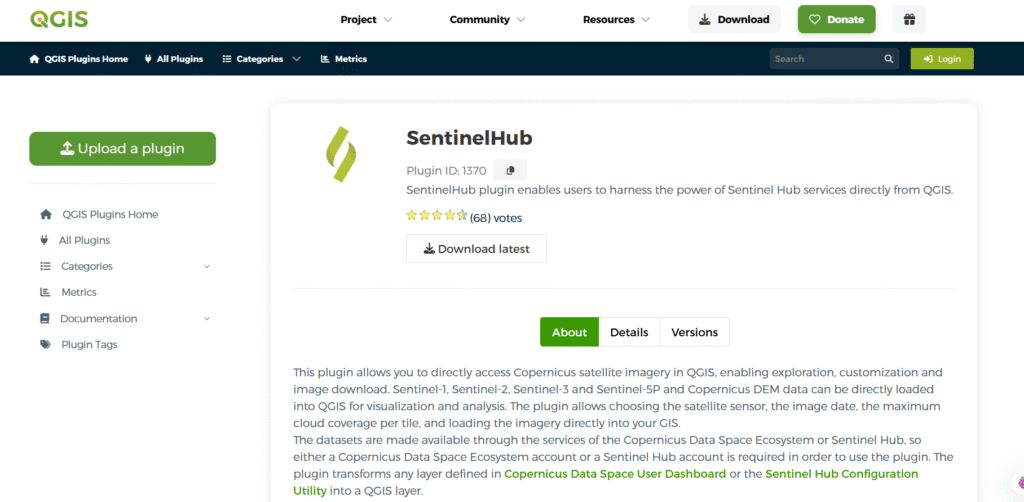
The Sentinel Hub Plugin is a powerful tool that allows QGIS users to access and visualize satellite imagery from Sentinel, MODIS, and Landsat missions—all from the cloud. Developed by Sinergise, this plugin connects to the Sentinel Hub API, offering fast and streamlined access to pre-processed, analysis-ready satellite data.
🔍 Key Features:
✅ Browse and Stream Satellite Data in Real-Time
Forget waiting hours to download full datasets. With Sentinel Hub:
-
Instantly browse Sentinel-2, Landsat 8, and MODIS imagery
-
View up-to-date scenes across the globe
-
Select specific areas of interest and time periods
-
Great for quick situational awareness in environmental monitoring, agriculture, and disaster response
✅ Create Custom Visualization Scripts
One of the unique features of Sentinel Hub is the ability to:
-
Write custom visualization scripts (in JavaScript or EO Browser syntax)
-
Apply band combinations, indices, and color stretches
-
Visualize indices like NDVI, NDWI, and false-color composites
This gives you total control over how satellite imagery appears, enabling you to highlight features like vegetation health, water bodies, or built-up areas.
✅ Download Cloud-Free Composites
You can also:
-
Download cloud-free image mosaics using Sentinel Hub’s cloud mask algorithms
-
Export pre-processed images directly to your local system or QGIS project
-
Choose from multiple data products: True Color, False Color, NDVI, SWIR, etc.
This is incredibly useful for applications like:
-
Crop monitoring
-
Urban mapping
-
Disaster management
-
Land change detection
✅ Works With Sentinel Hub Services
To use the plugin, you need to:
-
Create a Sentinel Hub account
-
Obtain your instance ID and API key
-
Set up custom layers or presets using their Configurator tool
This allows you to fully customize the data access and processing parameters to suit your project needs.
⚙️ Bonus Features:
-
Time-lapse animations
-
WMS/WMTS layer support
-
Multiple coordinate reference systems
-
Supports Statistical API for data analysis
5. Dzetsaka
Best For: Fast and accurate image classification using machine learning algorithms in QGIS

Dzetsaka is a lightweight yet powerful QGIS plugin specifically designed for machine learning-based classification of raster imagery. Whether you’re working on land cover mapping, vegetation analysis, or urban sprawl detection, Dzetsaka gives you the ability to run supervised classifications using advanced algorithms—all without leaving the familiar QGIS environment.
🔍 Key Features:
✅ Supports Popular Machine Learning Algorithms
Dzetsaka comes with built-in support for several widely used classifiers:
-
Random Forest (RF) – highly accurate and robust, ideal for noisy data
-
Support Vector Machine (SVM) – works well with high-dimensional data
-
K-Nearest Neighbors (KNN) – simple and effective for many classification tasks
These algorithms allow you to train models on your labeled sample points and classify entire satellite images or aerial photographs with minimal setup.
✅ Simple and Clean Interface
Unlike more complex tools, Dzetsaka is:
-
Designed with simplicity in mind
-
Features a user-friendly graphical interface
-
Suitable even for users who are new to machine learning or QGIS
Its clean workflow involves:
-
Adding training points
-
Selecting classification algorithms
-
Running the classification
-
Viewing results instantly
You don’t need to write any code or configure complicated parameters.
✅ Works with Any Raster Image
Dzetsaka is sensor-agnostic, meaning you can use:
-
Sentinel-2
-
Landsat
-
MODIS
-
Drone-captured imagery
-
Custom multi-band rasters
Whether you’re working with 3-band RGB imagery or 10+ band multispectral data, Dzetsaka can handle it with ease.
✅ Supervised Classification Workflow
Dzetsaka follows a straightforward supervised classification process:
-
Input raster and training samples (as shapefile or layer)
-
Choose algorithm and define parameters (e.g., number of trees in Random Forest)
-
Run the classification and save the output raster
You can also perform post-classification processing, such as accuracy assessment and class remapping, to refine your results.
6. Raster Calculator / BandCalc
Best For: Deriving vegetation indices like NDVI, SAVI, NDWI, and other custom band-based formulas

Raster Calculator (built into QGIS) and BandCalc (a plugin alternative) are essential tools for remote sensing analysts who need to calculate vegetation indices, soil moisture indicators, and other spectral band combinations.
These tools allow you to perform mathematical operations directly on raster bands, enabling detailed analysis of satellite or drone imagery.
🔍 Key Features:
✅ Mathematical Operations Between Bands
Raster Calculator and BandCalc let you:
-
Apply algebraic operations such as addition, subtraction, multiplication, division
-
Combine different raster layers (bands) to derive spectral indices
-
Example:
NDVI = (NIR - RED) / (NIR + RED)
where NIR and RED are raster layers or specific bands from Sentinel, Landsat, etc.
This flexibility allows you to highlight vegetation health, water presence, urban areas, or stressed land using customized formulas.
✅ Supports Custom Index Generation
With these tools, you can go beyond standard NDVI:
-
SAVI (Soil Adjusted Vegetation Index)
-
NDWI (Normalized Difference Water Index)
-
MSAVI (Modified Soil Adjusted Vegetation Index)
-
NBR (Normalized Burn Ratio)
-
Or any custom-built index for your specific project
This is particularly useful for:
-
Crop monitoring
-
Forest health assessment
-
Drought mapping
-
Wetland delineation
✅ Easy-to-Use Expression Builder
Whether you’re using Raster Calculator or BandCalc, both offer a visual interface with:
-
Drop-down menus for selecting raster bands
-
A syntax checker to avoid errors
-
A preview option to test your formulas
No need to write Python scripts—just input your expression and hit run.
BandCalc also includes:
-
Saved formula presets
-
Band grouping
-
Smoother integration with multi-band imagery
🌿 Ideal For Environmental Analysis
Here’s how Raster Calculator / BandCalc supports various types of remote sensing studies:
| Analysis Type | Common Indices | Purpose |
|---|---|---|
| Vegetation | NDVI, SAVI, MSAVI | Monitor crop health and biomass |
| Water Detection | NDWI, MNDWI | Locate water bodies and flooding |
| Burn Severity | NBR, dNBR | Assess damage from forest fires |
| Soil/Urban Mapping | NDBI, BSI | Detect bare soil and built-up areas |
Read More: 8 GIS Services That Make You Rich in 2025
7. QGIS Processing Toolbox (GRASS, SAGA, OTB tools)
Best For: Access to hundreds of remote sensing algorithms
The QGIS Processing Toolbox brings together powerful algorithms from multiple open-source libraries like GRASS GIS, SAGA GIS, and OTB, offering a wide range of advanced remote sensing tools. It’s an essential toolbox for anyone working with complex geospatial analysis, including terrain modeling, hydrological studies, and more.
🔍 Key Features:
✅ Terrain Modeling
The Processing Toolbox provides a variety of terrain analysis tools, including:
-
Slope, aspect, and hillshade generation
-
DEM (Digital Elevation Model) analysis
-
Terrain roughness and curvature calculations
These tools are essential for topographic studies and environmental analysis.
✅ Hydrological and Landform Analysis
With tools for hydrological modeling and landform analysis, you can:
-
Perform watershed and river basin delineation
-
Calculate flow accumulation and stream networks
-
Analyze landform features for environmental research and flood risk modeling
✅ Raster and Vector Operations
The toolbox also supports a wide range of raster and vector operations, such as:
-
Raster-based analysis for land cover, vegetation, and surface features
-
Vector data manipulation for buffer zones, intersection, and overlays
-
Rasterization of vector data for various analysis workflows
✅ Integration of Multiple Tools
Access to hundreds of algorithms from popular software like:
-
GRASS GIS (for advanced raster and vector operations)
-
SAGA GIS (for terrain and hydrological analysis)
-
OTB (for remote sensing and image processing)
This integration makes it easy to use a variety of powerful tools in one unified interface.
8. SCP ROI Tool
Best For: Creating and managing training samples
The SCP ROI Tool is an essential plugin for QGIS that simplifies the process of creating and managing Regions of Interest (ROIs) for classification tasks. Whether you’re performing supervised classification, machine learning, or validating your satellite imagery, this tool streamlines the creation and editing of training samples, which are crucial for accurate classification.
🔍 Key Features:
✅ Easy Labeling of ROIs
The SCP ROI Tool makes it effortless to create and label Regions of Interest (ROIs) directly within QGIS. Whether you are working with polygon, line, or point-based ROIs, this tool allows you to easily define the areas that represent different land cover types (e.g., water, vegetation, urban, etc.). You can:
-
Draw and label ROIs manually or automatically
-
Label ROIs with a simple interface for quick categorization
This enables efficient creation of high-quality training samples for classification purposes.
✅ Export ROIs for Use in SCP and ML Tools
Once the ROIs are created and labeled, the SCP ROI Tool allows you to export these samples for use in a variety of tools. These exported ROIs can be used in:
-
Semi-Automatic Classification Plugin (SCP) for supervised classification workflows
-
Machine Learning (ML) tools to train and validate machine learning models, enhancing the automation of classification processes
The ability to easily export ROIs ensures a smooth integration into remote sensing projects that involve both traditional classification methods and modern machine learning algorithms.
✅ Supports Batch Editing
Managing and editing multiple ROIs can be time-consuming, but the SCP ROI Tool simplifies this task with batch editing capabilities. You can:
-
Edit multiple ROIs simultaneously, saving time on repetitive tasks
-
Modify the labels and shapes of existing ROIs in bulk
-
Delete or update multiple ROIs with just a few clicks
This batch processing feature makes it easier to manage large datasets and ensures that your training samples remain accurate and consistent.
✅ Visualization and Quality Control
The SCP ROI Tool also provides excellent visualization capabilities, allowing you to:
-
View ROIs directly on the map canvas
-
Monitor ROI creation and editing in real-time
-
Ensure that training samples are accurately placed, which improves the quality of classification results
The ability to visually inspect and adjust your ROIs helps in maintaining the quality of your data and ensuring precise classification outcomes.
Read More: 10 Best 3D Map Generators in 2025
9. LEO Works (External)
Best For: Educational use and basic remote sensing operations

LEO Works is an external tool designed to simplify remote sensing workflows for students, beginners, and educators. It is particularly useful for those who are just starting with satellite imagery analysis and want to perform basic remote sensing operations without diving into more complex tools. LEO Works offers an easy-to-use interface and provides essential features for creating visual representations and analyzing satellite data.
🔍 Key Features:
✅ False-Color Composites
LEO Works simplifies the process of creating false-color composites, a key technique in remote sensing. By combining different bands from satellite imagery, users can generate false-color images that highlight specific features of the Earth’s surface, such as vegetation, water bodies, or urban areas. For example, in false-color composites, vegetation often appears in shades of red, making it easier to analyze the health and distribution of plant life. This tool allows you to:
-
Create false-color composites from multispectral satellite imagery
-
Highlight specific features like vegetation or water bodies
False-color composites are a valuable tool for land cover classification, vegetation analysis, and environmental monitoring.
✅ Simple Indices (NDVI, NDWI)
LEO Works provides built-in functions for calculating simple indices such as:
-
NDVI (Normalized Difference Vegetation Index): Used for monitoring vegetation health and assessing plant coverage. NDVI values indicate the presence and condition of vegetation, with high values indicating healthy vegetation.
-
NDWI (Normalized Difference Water Index): Used for detecting water bodies and analyzing their extent. NDWI is particularly useful for water resource management and flood monitoring.
These indices are essential for basic vegetation and water body analysis, and LEO Works makes them easy to compute with minimal setup. Users can quickly calculate these indices and visualize them for environmental and agricultural studies.
✅ Histogram and Contrast Adjustment
LEO Works includes tools for histogram and contrast adjustment, allowing users to enhance and modify the brightness, contrast, and overall appearance of satellite images. The ability to adjust histograms and contrast helps in:
-
Enhancing image quality for better visual interpretation
-
Improving feature differentiation in satellite imagery
-
Preparing images for further analysis or presentation
This feature is particularly helpful for students and beginners who are learning how image enhancements can improve data quality and interpretation.
✅ User-Friendly Interface for Educational Purposes
Designed with simplicity in mind, LEO Works offers a user-friendly interface that is ideal for beginners. Students and educators can easily learn how to import, manipulate, and analyze satellite imagery with just a few clicks. The intuitive layout ensures that even those with limited experience in remote sensing can grasp basic concepts like image band manipulation, index calculation, and image enhancement.
10. Raster Attribute Table Plugin
Best For: Visualizing and editing raster classification results
The Raster Attribute Table Plugin is a valuable tool for QGIS users who work with raster data, especially when it comes to visualizing and editing classification results. After performing classification on raster datasets, this plugin helps in organizing, editing, and enhancing the raster data’s attributes, making it easier to interpret and present the analysis results.
This tool is essential for post-processing, creating legends, and generating reports for classification tasks in remote sensing.
🔍 Key Features:
✅ Add and Modify Class Attributes
The Raster Attribute Table Plugin enables users to add and modify class attributes within raster datasets, giving them full control over the classification results. After classifying raster data (such as land cover or vegetation types), you can:
-
Edit the attribute values associated with each class or category.
-
Assign descriptive names to each class, such as “forest,” “water,” “urban,” etc., to make interpretation easier.
-
Modify other relevant attributes like area, mean values, or other properties associated with each class.
This capability allows users to refine their classifications and ensure the data is organized according to specific needs or standards.
✅ Color-Code Raster Categories
One of the most useful features of the Raster Attribute Table Plugin is its ability to color-code raster categories. By assigning distinct colors to each class or category in your raster dataset, users can:
-
Visually distinguish between different land cover types or feature categories.
-
Enhance the clarity of raster images, making them easier to interpret and analyze.
This feature is especially helpful for creating thematic maps, where the different categories (e.g., vegetation, water, urban areas) are color-coded to enhance visual distinction.
✅ Create Intuitive Legends
The plugin makes it easy to create intuitive legends for your raster data. Once the raster classes are defined and color-coded, the tool automatically generates a legend that matches the color scheme, helping viewers understand what each color represents. This legend can be included in maps, reports, and presentations. The intuitive legend creation process includes:
-
Automatic generation of color-coded legends based on class attributes
-
Customizable legends to suit the needs of your map or analysis
-
Easy export of the legend for use in reports and publications
This feature ensures that your raster classification maps are not only visually clear but also easy to interpret by others, making them ideal for educational or professional presentations.
✅ Post-Processing and Report Generation
The Raster Attribute Table Plugin is invaluable for post-processing raster datasets after classification. Once the classification process is complete, the plugin helps refine and modify the data, making it more suitable for analysis or publication. With its ability to manage class attributes, color codes, and legends, the tool is perfect for:
-
Generating reports: By creating a well-labeled and color-coded raster map, you can easily incorporate this data into reports, publications, and presentations.
-
Enhancing classification results: Post-classification, the plugin allows for fine-tuning, improving the overall quality and accuracy of the data.
-
Map customization: You can customize the raster output, preparing it for final presentation by adjusting the visualization settings.
🎯 Final Thoughts
QGIS is a powerhouse for remote sensing when equipped with the right plugins. Whether you’re working with Sentinel-2 imagery, calculating vegetation indices, or training machine learning models, the plugins listed above will elevate your workflow.
If you’re serious about remote sensing with QGIS, start by installing SCP, OTB, and Dzetsaka — the holy trinity of image classification!
FAQ: Top 10 Best QGIS Plugins for Remote Sensing in 2025
Q: What is QGIS and why is it used in remote sensing?
QGIS (Quantum GIS) is an open-source Geographic Information System (GIS) that enables users to create, edit, visualize, analyze, and publish geospatial data. In remote sensing, QGIS is widely used to process and analyze satellite imagery, aerial photographs, and other remotely sensed data. The software supports a variety of plugins that enhance its functionality, making it an ideal tool for working with geospatial data.
Q: Are these QGIS plugins free to use?
Yes! All of the plugins mentioned in this blog post are free and open-source. QGIS itself is also an open-source software, and these plugins are built to extend QGIS’s capabilities without any additional cost.
Q: How do I install these plugins in QGIS?
Installing QGIS plugins is easy. Simply follow these steps:
Open QGIS.
Go to the Plugins menu and click Manage and Install Plugins.
Search for the plugin by name.
Click Install. After installation, the plugin will be available for use in the relevant toolbars or menus within QGIS.
Q: Can I use these plugins for academic or research purposes?
Absolutely! Many of these plugins, such as the Semi-Automatic Classification Plugin (SCP) and SCP ROI Tool, are particularly useful for academic research and environmental studies. They provide essential tools for processing satellite imagery, performing classification, and analyzing remote sensing data, making them ideal for research projects.
Q: Do I need advanced knowledge of QGIS to use these plugins?
While some plugins may require a basic understanding of remote sensing concepts and QGIS itself, most of these plugins are designed to be user-friendly. Plugins like LEO Works are tailored for beginners, while others, like SCP ROI Tool and Raster Attribute Table Plugin, cater to more advanced users, offering powerful tools for classification and post-processing.
2 thoughts on “Top 10 Best QGIS Plugins for Remote Sensing in 2025 (Free & Powerful Tools)”