How GIS is Revolutionizing Irrigation Planning in Dry Regions [2025]

Irrigation

Practical Examples from Arid/Semi-Arid Zones Using Water Efficiency In water-scarce areas, especially arid and semi-arid regions, efficient irrigation is not just a choice—it’s a necessity. Geographic Information Systems (GIS) are playing a transformative role in modern irrigation planning, helping farmers and planners make informed, data-driven decisions to optimize water usage, increase crop productivity, and ensure sustainability. In this blog post, we explore how GIS technology is revolutionizing irrigation planning in dry regions, with real-world examples and practical applications. What is GIS and Why is it Important for Irrigation? GIS (Geographic Information System) is a powerful tool that captures, stores, analyzes, and visualizes spatial data. In irrigation planning, GIS integrates satellite imagery, climate data, soil maps, and topographic information to help determine: Where water is most needed How water can be delivered efficiently What crops are best suited to specific micro-zones How much water is needed at different times Challenges in Irrigation Planning in Dry Regions Dry regions often face: Low and erratic rainfall High evaporation rates Saline or degraded soils Limited groundwater resources Traditional irrigation planning in such regions can result in water wastage, poor crop yields, and land degradation. That’s where GIS changes the game. How GIS Helps in Smart Irrigation Planning 1. Identifying Suitable Cropping Zones GIS can combine layers of soil texture, slope, and climate data to classify land into zones most suitable for certain crops. This prevents farmers from growing water-intensive crops in unsuitable areas. Example:In Rajasthan, India, GIS tools helped identify suitable areas for less water-intensive crops like millet and pulses, replacing water-thirsty sugarcane and saving millions of liters of water annually. 2. Designing Efficient Irrigation Networks By analyzing topography and elevation data, GIS supports the design of gravity-fed irrigation systems that reduce the need for pumps and conserve energy. Example:In the Mekelle region of Ethiopia, GIS mapping helped in designing contour-based irrigation channels that reduced runoff and increased water retention in the soil. 3. Monitoring Crop Health and Water Stress With remote sensing data, GIS can detect NDVI (Normalized Difference Vegetation Index) to assess crop health and identify areas under water stress, enabling timely interventions. Example:In southern California, GIS-based NDVI analysis allowed almond farmers to adjust irrigation zones based on real-time plant stress levels, leading to a 20% increase in water-use efficiency. 4. Groundwater Mapping and Recharge Planning GIS helps identify aquifer zones, groundwater recharge areas, and over-extraction hotspots, supporting better regulation and sustainable use of underground water. Example:In Baluchistan, Pakistan, GIS-supported groundwater mapping helped install tubewells in sustainable zones while avoiding overexploited aquifers, reducing long-term water table decline. Related Content: Land Suitability Analysis for Agriculture Using GIS: Methods & Case Studies Top 5 GIS Projects to Improve Food Security in Developing Countries How to Use QGIS for Precision Farming: A Beginner’s Guide 5. Precision Irrigation and Drip System Design GIS allows for precision agriculture where drip irrigation lines are placed based on soil type, plant spacing, and slope, ensuring water reaches the roots without waste. Example:In Israel’s Negev Desert, GIS-guided drip irrigation systems have helped grow vegetables and fruits with up to 40% less water compared to conventional methods. Benefits of Using GIS in Irrigation for Dry Regions ✔ Optimized water use✔ Improved crop yields✔ Lower input costs (fertilizer, energy, water)✔ Reduced land degradation✔ Better climate resilience SEO Keywords to Remember: GIS in irrigation planning Smart irrigation in arid zones Water efficiency with GIS GIS agriculture applications Precision farming in dry regions GIS for sustainable water use Final Thoughts GIS is no longer a futuristic concept—it’s a practical and powerful solution for farmers and planners dealing with water scarcity in dry regions. From designing efficient irrigation networks to selecting suitable crops and detecting water stress, GIS empowers decision-making like never before. As climate change continues to challenge water availability, embracing GIS in irrigation planning isn’t just smart—it’s essential. Frequently Asked Questions (FAQs) 1. How does GIS help in irrigation planning? Answer: GIS helps in irrigation planning by analyzing spatial data such as soil type, topography, rainfall patterns, and crop suitability. This allows planners to design efficient irrigation systems, reduce water waste, and improve crop productivity, especially in arid and semi-arid regions. 2. Can GIS improve water efficiency in agriculture? Answer: Yes. GIS enables precision agriculture by identifying zones of water stress, designing accurate drip irrigation systems, and recommending crops that require less water—resulting in significantly improved water-use efficiency. 3. Is GIS cost-effective for small-scale farmers? Answer: Initially, GIS implementation may require investment, but many governments and NGOs now offer GIS-based tools and services at low or no cost. Over time, farmers benefit from reduced water bills, increased yield, and optimized resource use, making it highly cost-effective. 4. Which regions have successfully implemented GIS for irrigation? Answer: Regions like Rajasthan (India), Negev Desert (Israel), Baluchistan (Pakistan), and Southern California (USA) have successfully implemented GIS for smart irrigation planning, resulting in substantial water savings and increased crop yields. 5. What kind of data does GIS use for irrigation planning? Answer: GIS uses various data types including: Satellite imagery Soil maps Rainfall and temperature data Land slope and elevation models Vegetation indices like NDVI These datasets are layered and analyzed to support informed decision-making.
Land Suitability Analysis for Agriculture Using GIS: Methods & Case Studies [2025]

Land Suitability Analysis for Agriculture Using GIS

Land Suitability Analysis for Agriculture Using GIS: Methods & Case Studies perfect for Professional GIS Users. In an era of rapid population growth and increasing pressure on land resources, ensuring sustainable agricultural productivity is more important than ever. Land Suitability Analysis (LSA) using Geographic Information Systems (GIS) offers a modern and scientific approach to identifying the most appropriate areas for agriculture. This powerful tool supports soil scientists, agronomists, and land use planners in making data-driven decisions for sustainable land management. In this blog post, we’ll explore: What is Land Suitability Analysis? Why use GIS in Land Suitability Assessment? Key Methods and Criteria in GIS-based LSA Case Studies from around the world Applications in soil science and land use planning What is Land Suitability Analysis? Land Suitability Analysis is the process of evaluating a piece of land to determine its fitness for a specific type of land use—in this case, agriculture. It involves comparing land characteristics (soil type, slope, rainfall, temperature, etc.) against the requirements of different crops. Traditionally, this was done manually, but modern GIS technologies now allow for more accurate, faster, and spatially detailed assessments. Why Use GIS for Land Suitability? GIS brings several advantages to the table: 📍 Spatial Accuracy: Ability to map and analyze large areas with high precision. 📊 Data Integration: Combines multiple layers like soil maps, topography, climate, and land cover. ⚡ Speed & Efficiency: Reduces time and labor required in traditional field assessments. 🎯 Decision Support: Provides visual and analytical tools to guide sustainable agricultural development. Methods of Land Suitability Analysis for Agriculture Using GIS There are several standard methods used in Land Suitability Analysis for Agriculture Using GIS. These include: 1. FAO Framework The FAO (Food and Agriculture Organization) developed a comprehensive and standardized framework for evaluating land suitability, which remains one of the most widely adopted methodologies worldwide. This framework assesses land based on how well it can support a specific type of land use—most commonly agricultural production. FAO Suitability Classes: The classification divides land into five main categories: S1 – Highly SuitableThe land has no or only minor limitations for the intended use. It can produce high yields with minimal inputs and is ideal for sustainable agriculture. S2 – Moderately SuitableThe land has some limitations (e.g., less optimal soil texture, slight slope, or moderate climate variation) that may reduce productivity or require moderate inputs like irrigation or fertilizers. S3 – Marginally SuitableThe land has significant limitations that limit productivity. Crop yields may be lower, and it may require major improvements or input for viable farming. N1 – Currently Not SuitableThe land is not suitable under present conditions, but could be made usable through significant investments or land improvements like drainage, soil amendment, or terracing. N2 – Permanently Not SuitableThe land has limitations that are either too severe or impractical to overcome. Examples include rocky terrains, extremely steep slopes, or highly saline soils. How GIS Enhances the FAO Framework GIS technology plays a crucial role in implementing this framework at scale. Here’s how: Spatial Analysis: GIS can map suitability classes across entire regions using soil, topography, and climate data. Data Integration: Layers such as rainfall, soil pH, land cover, and elevation can be overlaid and analyzed simultaneously. Visualization: The output is often presented as a Land Suitability Map, showing areas classified from S1 to N2, enabling easier interpretation for planners and stakeholders. Decision Support: Governments, NGOs, and agricultural investors can use GIS-generated suitability maps for zoning, irrigation planning, and sustainable land management. 2. Multi-Criteria Evaluation (MCE) Multi-Criteria Evaluation (MCE) is a powerful decision-making approach used in GIS to evaluate land suitability by considering multiple environmental, physical, and socio-economic factors. It is especially valuable when no single factor can determine land suitability, and a combination of variables must be assessed simultaneously. At the heart of MCE lies the Weighted Overlay Analysis—a spatial analysis technique where each criterion is given a specific importance (weight) and then overlaid to create a composite suitability map. How MCE Works in GIS: Selection of Criteria (Factors):The first step is to identify the key factors affecting land suitability for a particular crop or land use. Common criteria include: Soil pH – Influences nutrient availability and crop growth. Drainage – Affects water retention and root development. Rainfall – Determines water availability, essential for crop productivity. Slope – Influences erosion risk and ease of mechanized farming. Standardization of Data:All input layers are converted to a common scale, usually from 0 (unsuitable) to 1 (highly suitable), to ensure comparability. This process is essential because the original data might be in different units (e.g., mm for rainfall, % for slope). Assigning Weights to Each Factor:Each criterion is assigned a weight based on its relative importance to the target land use. For instance, rainfall may be given 40% weight for rice cultivation, while soil pH might receive 30%. Weighted Overlay Analysis:The standardized and weighted layers are combined using raster math in the GIS environment. The resulting output is a suitability map, which visually represents the degree of suitability of each area. Classification of Results:The output is typically classified into categories such as: Highly Suitable Moderately Suitable Marginally Suitable Unsuitable Tools Commonly Used for MCE ArcGIS Weighted Overlay Tool QGIS Raster Calculator & SAGA/GRASS plugins IDRISI’s Decision Support Module Advantages of MCE Flexible and customizable – Criteria and weights can be tailored to specific crops or regions. Integrates expert knowledge – Local agricultural experts can help define appropriate weights. Transparent process – Easy to document and justify each step in decision-making. Related Content: How to Use QGIS for Precision Farming: A Beginner’s Guide 10 Emerging Trends in Geospatial Technology for Agriculture Top 10 GIS-Based Dissertation Topics for Agricultural Students 3. Analytic Hierarchy Process (AHP) The Analytic Hierarchy Process (AHP) is an advanced, structured decision-making technique that is often used within Multi-Criteria Evaluation (MCE) frameworks. Developed by Thomas L. Saaty, AHP provides a systematic and mathematical way to assign weights to various factors based on their relative importance—using pairwise comparisons. Unlike arbitrary or expert-driven weighting … Read more

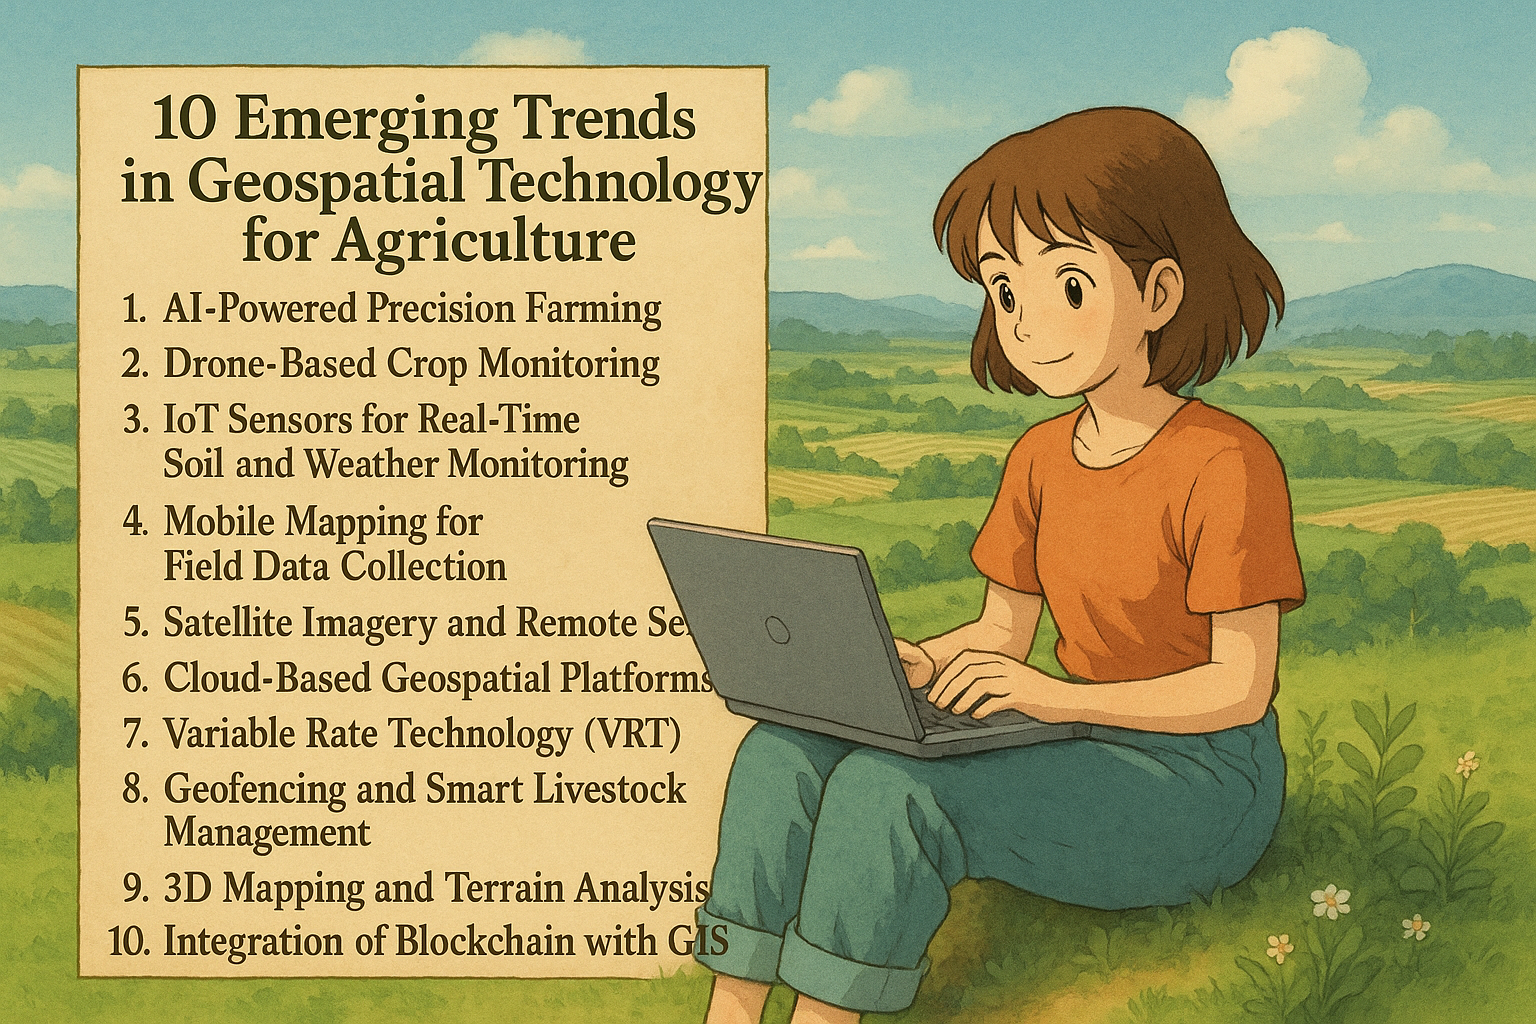
10 Emerging Trends in Geospatial Technology for Agriculture

Trends in Geospatial Technology

In the age of smart farming, geospatial technology is transforming how we grow food and manage land. With the integration of GIS (Geographic Information Systems), AI (Artificial Intelligence), drones, mobile mapping, and the Internet of Things (IoT), agriculture is becoming more efficient, sustainable, and data-driven. This blog explores 10 emerging trends in geospatial technology for agriculture that are shaping the future of food production. 10 Emerging Trends in Geospatial Technology 1. AI-Powered Precision Farming Artificial Intelligence (AI) is at the forefront of the precision agriculture revolution, enabling farmers to make data-driven decisions with remarkable speed and accuracy. By leveraging machine learning algorithms, AI systems can process vast amounts of data collected from satellites, drones, sensors, and farm equipment. One of the key benefits of AI in agriculture is its ability to analyze real-time data such as weather patterns, soil composition, crop health indicators, and historical yield records. This data is then used to generate actionable insights that help farmers: Predict crop yields more accurately Identify and prevent pest infestations or crop diseases before they spread Optimize irrigation schedules and nutrient application Reduce input waste (fertilizer, water, pesticides) while maximizing outputs When integrated with Geographic Information Systems (GIS), AI becomes even more powerful. AI and GIS integration allows farmers to visualize spatial data through interactive maps, identify problem zones in specific fields, and apply resources only where needed—minimizing costs and environmental impact. For example, AI models can detect subtle changes in plant coloration from satellite or drone imagery to flag early signs of crop stress. Combined with GPS-enabled machinery, this allows for targeted interventions down to the square meter. In addition, AI is also being used in automated machinery like self-driving tractors and smart harvesters, further advancing precision farming techniques. As agricultural challenges grow—ranging from climate change to population pressure—AI-powered precision farming is becoming essential for sustainability, profitability, and global food security. Keyword Focus: AI in agriculture, precision farming, AI and GIS integration, smart farming with AI, AI crop prediction, geospatial AI agriculture 2. Drone-Based Crop Monitoring The use of drones in agriculture has rapidly evolved from a novelty to a necessity. These Unmanned Aerial Vehicles (UAVs) are now essential tools for modern precision farming, offering a fast, efficient, and highly accurate way to monitor large agricultural fields. Equipped with multispectral, hyperspectral, and thermal sensors, crop monitoring drones can capture detailed aerial imagery that the human eye simply cannot detect from the ground. These high-resolution images help farmers observe: Plant health and stress through vegetation indices like NDVI (Normalized Difference Vegetation Index) Water distribution to identify over- or under-irrigated areas Pest infestations and disease outbreaks at an early stage Crop emergence and growth uniformity across different field zones Storm or drought damage assessment in real-time Drones provide frequent and flexible data collection, allowing farmers to monitor crops at any growth stage and respond quickly to issues. This is particularly useful in large-scale farming operations where traditional scouting methods are labor-intensive and time-consuming. In addition to monitoring, some drones are now used for precision spraying of pesticides and fertilizers. These spraying drones reduce chemical usage by applying inputs only where needed, improving environmental safety and lowering operational costs. Another major benefit of UAV mapping is the ability to generate 3D terrain models and orthomosaic maps of fields. These maps assist in planning irrigation systems, analyzing drainage, and managing soil erosion—all critical factors for sustainable farming. With advancements in AI and automation, the future of drone-based agriculture looks even more promising. Autonomous drone fleets, real-time AI analysis, and live data streaming are just a few innovations on the horizon. Keyword Focus: drones in agriculture, crop monitoring drones, UAV mapping, drone crop health analysis, drone farming technology, precision agriculture drones 3. IoT Sensors for Real-Time Soil and Weather Monitoring The Internet of Things (IoT) is revolutionizing smart agriculture by enabling real-time data collection from fields through interconnected sensors and devices. These IoT in farming systems provide farmers with continuous, accurate, and location-specific information about their crops, soil, and environmental conditions. IoT sensors can be deployed across farmlands to monitor crucial variables such as: Soil moisture levels to prevent over- or under-irrigation Soil temperature to determine optimal planting and harvesting times Ambient temperature and humidity for better pest and disease control Rainfall and weather patterns for forecasting and planning field activities When this data is integrated with GIS platforms, it becomes even more powerful. GIS allows farmers to visualize sensor data on digital maps, identify patterns, and make precise, field-specific decisions. For example, a farmer can set up an automated irrigation system that responds to real-time soil moisture readings, reducing water waste and improving crop health. This form of real-time soil monitoring helps in: Smart irrigation management—watering only where and when needed Fertilizer application optimization based on soil nutrient data Early warning systems for drought, frost, or extreme weather events Efficient resource planning and reducing environmental impact The integration of IoT in farming is also paving the way for predictive analytics, where collected data is used to model future scenarios—such as expected yields or pest outbreaks—enabling proactive farm management. As 5G networks and cloud-based analytics continue to grow, IoT applications in agriculture will become faster, more reliable, and more scalable, even for small and medium-sized farms. Keyword Focus: IoT in farming, smart agriculture, real-time soil monitoring, IoT sensors for irrigation, agricultural weather sensors, precision farming with IoT 4. Mobile Mapping for Field Data Collection With the rise of smartphones and tablets equipped with built-in GPS, mobile mapping has become an essential tool in modern agriculture. Using mobile GIS apps, farmers, agronomists, and field technicians can now collect, edit, and analyze georeferenced data directly from the field—without the need for expensive or bulky equipment. This approach to field data collection using GIS enables real-time decision-making, enhances data accuracy, and reduces delays between observation and action. Users can: Mark field boundaries or specific problem areas Record observations such as pest infestations, crop diseases, or irrigation issues Capture geotagged photos and notes for later analysis Upload data … Read more

7 Powerful GIS Applications in Agriculture

GIS applications in agriculture

In the modern era of precision agriculture, Geographic Information Systems (GIS) have become a game-changer. By integrating location-based data with farming practices, GIS empowers farmers, agronomists, and agricultural policymakers to make smarter, data-driven decisions. In this blog post, we’ll explore 7 powerful GIS applications in agriculture that are revolutionizing how food is grown, managed, and delivered—all with improved efficiency and sustainability. 7 Powerful GIS Applications in Agriculture 1. Precision Farming and Site-Specific Management Precision farming, also known as site-specific crop management (SSCM), is a cutting-edge agricultural technique that uses Geographic Information Systems (GIS) to observe, measure, and respond to field variability in real-time. It enables farmers to make smarter decisions tailored to specific parts of their land, rather than managing entire fields uniformly. What is Site-Specific Management? Site-Specific Management is the practice of customizing farming inputs (like seeds, fertilizers, pesticides, and irrigation) based on spatial data collected about different parts of a field. This is where GIS comes into play—it helps identify variations within a field and provides location-specific insights. How GIS Powers Precision Farming: Data Collection and MappingGIS integrates data from multiple sources like satellite imagery, drones, soil sensors, and yield monitors. These datasets are layered and analyzed to understand field conditions including: Soil fertility and moisture Crop health Topography and drainage Pest and disease outbreaks Variable Rate Technology (VRT)With GIS maps, farmers can use VRT equipment to apply inputs variably across the field. For example: Apply more fertilizer to nutrient-deficient zones Reduce water use in naturally moist areas Target pest control only where needed Increased EfficiencyBy applying inputs precisely where they’re needed, farmers reduce waste, lower input costs, and enhance productivity. This reduces environmental impact and supports sustainable farming. Real-Time MonitoringGIS allows farmers to monitor field performance throughout the season. They can adjust strategies based on weather patterns, crop growth, and pest dynamics. Historical Data AnalysisGIS stores historical records of yield and crop health across seasons. Analyzing this data helps identify patterns and long-term trends that influence decision-making for future seasons. Benefits of Using GIS in Precision Farming: Improved crop yields and quality Optimized use of seeds, fertilizers, and water Reduced environmental footprint Early detection of diseases and pests Cost-effective and sustainable operations Example in Practice: A rice farmer using GIS in Nepal might divide a 10-hectare field into zones based on soil moisture. Instead of flooding the entire field uniformly, irrigation is applied only to the drier zones. Over time, this technique can save thousands of liters of water while increasing rice productivity. 2. Soil Mapping and Analysis Understanding the soil beneath our feet is the cornerstone of successful agriculture. Soil properties—such as texture, fertility, moisture, and pH—have a direct impact on plant health, crop yield, and input efficiency. GIS (Geographic Information Systems) has transformed traditional soil study into a spatially rich and highly actionable process known as soil mapping and analysis. What is Soil Mapping? Soil mapping is the process of identifying, classifying, and spatially representing different soil types and their properties across a landscape. With the help of GIS, farmers and agronomists can create high-resolution, interactive maps that visualize these properties at field, farm, or regional scales. How GIS Supports Soil Mapping and Analysis: Soil Type ClassificationGIS helps in the creation of detailed maps that show the distribution of soil types like: Clay (retains water, ideal for rice) Loam (fertile, well-drained, suitable for most crops) Sandy (drains quickly, needs frequent watering) Spatial Analysis of Soil PropertiesUsing data from sensors, soil samples, and remote sensing, GIS analyzes: pH levels: Indicates soil acidity or alkalinity, crucial for crop suitability Organic matter: Supports microbial life and improves fertility Moisture content: Affects irrigation planning and drought resistance Cation exchange capacity (CEC): Determines nutrient retention ability Detection of Nutrient DeficienciesGIS maps highlight zones with deficiencies in nitrogen, phosphorus, potassium, and trace elements. This enables farmers to apply targeted fertilizer treatments, rather than wasting resources uniformly. Temporal MonitoringOver time, GIS can show how soil quality is changing due to overuse, erosion, or improved practices. This is useful for land restoration and conservation planning. 3D Soil ModelingWith digital elevation models (DEMs), GIS can create 3D models of soil layers, helping understand soil depth, drainage patterns, and erosion risks. Benefits for Farmers and Planners: Crop Suitability Planning: Select the most appropriate crops based on soil compatibility. Efficient Fertilizer Use: Apply nutrients only where needed, reducing costs and runoff. Better Irrigation Scheduling: Understand moisture retention to reduce water waste. Soil Conservation: Identify erosion-prone zones and implement sustainable practices. Real-World Example: A wheat farmer in India uses GIS to map soil pH and organic content across a 50-acre farm. The analysis shows that the eastern plots are slightly acidic and low in nitrogen. Based on this insight, the farmer applies lime and nitrogen-rich fertilizers only to that area, improving yield by 15% and reducing input cost by 20%. Related Content:  7 Powerful GIS Applications in Climate Science 10 Best QGIS Plugins for Digitizing 12 Best Business Ideas for Land Surveyors in 2025 GIS Software Development: A Complete Roadmap for 2025 3. Weather Monitoring and Forecasting Weather is one of the most critical factors in agriculture. A single untimely rainfall or a sudden frost can damage entire crops and disrupt food production. That’s why weather monitoring and forecasting, powered by GIS (Geographic Information Systems), has become an essential tool for modern-day farmers. By integrating real-time and historical weather data with spatial farm maps, GIS helps farmers make informed, timely decisions that protect their crops and maximize productivity—even in the face of climate uncertainty. How GIS Enhances Weather Monitoring: Real-Time Data IntegrationGIS can ingest live data from: Weather satellites Ground-based meteorological stations IoT weather sensors on the farm This data is spatially visualized across farm areas to monitor: Rainfall distribution Temperature fluctuations Humidity levels Wind direction and speed Forecasting and Early Warning SystemsGIS platforms can overlay weather models with farm maps to forecast: Rainfall or drought probabilities Storm or hail threats Frost risk during critical growth stages Heatwaves or cold spells These forecasts help in proactive … Read more

GIS Software Development: A Complete Roadmap for 2025

Advanced Diploma

In today’s data-driven world, Geographic Information System (GIS) software plays a vital role across industries. From urban planning and agriculture to disaster management and navigation, GIS is everywhere. But how do you go about developing GIS software in 2025? This blog post will walk you through a complete, step-by-step roadmap to mastering GIS software development. 8 Phase of GIS Software Development Phase 1: Understand the Fundamentals of GIS Before you can begin developing GIS software, it’s essential to gain a solid understanding of the core geospatial principles that form the foundation of all GIS applications. This knowledge not only helps in building accurate and efficient GIS tools but also enables you to understand real-world spatial problems more effectively. Coordinate Systems One of the most critical concepts in GIS is understanding coordinate systems, which allow spatial data to be accurately located on the Earth’s surface. There are two primary types: Geographic Coordinate System (GCS): This system uses latitude and longitude to define locations. It is based on a spherical model of the Earth and is commonly used for global datasets. Example: WGS84 (used in GPS) Projected Coordinate System (PCS): This system projects the 3D Earth onto a 2D map, making it easier to measure distances, areas, and angles. Examples: UTM (Universal Transverse Mercator), State Plane Coordinate System Understanding when and how to use each system is essential for maintaining spatial accuracy and avoiding location errors in your GIS applications. Map Projections and Datum Map projections transform geographic coordinates into a flat map. However, no projection is perfect—each distorts shape, area, distance, or direction to some extent. Common Projections: WGS84: Global standard used in GPS NAD83: North America-specific Mercator: Preserves direction, distorts area Lambert Conformal Conic: Often used for weather and aeronautical maps Datum defines the reference point and surface for measuring locations. Choosing the right projection and datum is crucial for accurate geospatial analysis. Raster vs. Vector Data GIS data comes in two major formats: Raster Data: A pixel-based format commonly used for satellite imagery, elevation models, and land cover maps. Examples: GeoTIFF, .img files Suitable for continuous data (e.g., temperature, elevation) Vector Data: Represents data using points, lines, and polygons. Examples: Shapefiles, GeoJSON, KML Suitable for discrete data (e.g., roads, boundaries, landmarks) Understanding when to use raster vs. vector is key for building performant and accurate GIS tools. Layers, Features, and Attributes GIS data is organized into layers, which stack spatial information for different themes (like roads, rivers, or population density). Each layer contains features (e.g., a road or lake), and each feature has attributes stored in a table. Example: A road feature might have attributes like name, length, type, and speed limit. Knowing how to structure, store, and query layers and attributes is a core skill for any GIS developer. Topology and Geocoding Topology defines the spatial relationships between features (e.g., adjacency, connectivity, and containment). It’s essential for tasks like validating road networks or detecting overlapping parcels. Geocoding converts textual addresses into geographic coordinates (latitude/longitude), which is critical for location-based services and logistics. These concepts help you implement advanced GIS functionalities like route planning, network analysis, and spatial validation. Routing and Interpolation Routing uses algorithms to find the optimal path between locations. It’s vital for applications in logistics, emergency response, and navigation. Common algorithms: Dijkstra’s, A* Interpolation estimates unknown values between known data points. For example, creating a temperature map from scattered sensor readings. Methods: IDW (Inverse Distance Weighting), Kriging These functions are commonly implemented in web GIS apps, spatial analysis tools, and data science workflows. Real-World Use Cases of GIS Fundamentals Understanding these fundamentals prepares you to tackle real-world applications, such as: Urban Development: Land use planning, zoning, infrastructure mapping Environmental Monitoring: Forest cover change, pollution tracking, habitat mapping Transportation: Route optimization, traffic flow analysis Surveying and Land Management: Cadastral mapping, boundary verification Disaster Management: Flood risk mapping, evacuation planning Telecommunications: Network coverage analysis, tower placement Phase 2: Learn Programming Languages for GIS After understanding the core geospatial concepts, the next step in the GIS software development roadmap is learning programming languages tailored to geospatial applications. Each language serves a specific purpose—some are better for backend scripting, others for web or desktop development. Choosing the right tools for the job can make your GIS project more efficient, scalable, and user-friendly. Let’s explore the most important programming languages for GIS development in 2025: Core Languages Every GIS Developer Should Know Python: The Backbone of GIS Automation and Analysis Python is the most widely used language in the GIS ecosystem due to its simplicity, readability, and vast ecosystem of geospatial libraries. Use Cases: Automating geoprocessing tasks with ArcPy (ArcGIS) Spatial analysis with libraries like GeoPandas, Shapely, and Rasterio Web GIS backends using Flask or Django Why Learn Python? Huge community support Cross-platform compatibility Essential for working with tools like QGIS and ArcGIS Pro JavaScript: For Interactive Web Mapping Applications JavaScript is the go-to language for developing dynamic and interactive GIS applications on the web. Popular Libraries: Leaflet.js: Lightweight and easy to use Mapbox GL JS: Powerful and customizable OpenLayers: Feature-rich and professional-grade Why Learn JavaScript? Real-time map rendering in browsers Integration with APIs like Google Maps, HERE Maps, and Mapbox Enables responsive, mobile-friendly GIS tools C++/C# or Java: For Desktop GIS Development If you’re developing high-performance desktop GIS applications or working with large datasets, you’ll benefit from learning C++ or C# (for Windows-based apps) or Java (for cross-platform applications). C++: Known for speed and used in the core of GIS engines like QGIS and GDAL. C#: Common for building Windows desktop applications with rich UIs. Java: Used in enterprise-level GIS applications and tools like GeoTools. Use Cases: Custom plugins for QGIS or ArcGIS Building standalone GIS software Developing GIS extensions for engineering applications SQL: Essential for Spatial Databases Structured Query Language (SQL) is critical for storing, querying, and managing spatial data in databases. Key Tools: PostgreSQL + PostGIS (most popular open-source spatial database) MySQL Spatial Extensions SpatiaLite (lightweight spatial database) What You’ll Learn: Creating spatial indexes Performing spatial joins … Read more

8 GIS Services That Make You Rich in 2025

GIS Services

Geographic Information Systems (GIS) are no longer just tools for scientists or government agencies. In 2025, GIS services are empowering entrepreneurs, startups, and tech-savvy professionals to build wealth through data-driven decision-making, smart infrastructure, and digital transformation. Whether you’re a real estate developer, tech consultant, urban planner, or investor, these 8 profitable GIS services can help you tap into billion-dollar industries with ease. 8 GIS Services That Make You Rich 1. Geospatial Mapping: The Foundation of Smart Decision-Making Geospatial mapping is the process of collecting, analyzing, and visualizing spatial data to create maps that help people understand the world around them. These maps go far beyond simple locations—they reveal patterns, trends, and relationships between objects, locations, and events in both natural and built environments. At its core, geospatial mapping translates data into a visual format, making it easier to interpret complex information. By overlaying different layers—such as roads, land use, vegetation, infrastructure, and population density—decision-makers can gain a comprehensive view of any area on the planet. Applications of Geospatial Mapping in 2025: Urban Planning: City planners use it to design smarter, more efficient infrastructure. Real Estate: Developers identify high-value plots, assess land features, and optimize property layouts. Agriculture: Farmers and agribusinesses use it to monitor crop health, soil conditions, and yield zones. Logistics & Supply Chain: Delivery and transportation companies optimize routes, reduce fuel costs, and improve service areas. Disaster Management: Emergency teams assess flood zones, fire-prone areas, and evacuation routes in real time. Geospatial mapping combines multiple data sources, such as satellite imagery, GPS coordinates, drone footage, and historical records, to build highly accurate, interactive maps. Tools like ArcGIS, QGIS, and Mapbox have become industry standards for professionals offering mapping services. 💡 Why it makes you rich: High Demand Across Industries: Real estate developers, governments, utility companies, and logistics providers need spatial intelligence to operate efficiently. Premium Consulting Rates: Businesses are willing to invest heavily in location-based insights that can reduce operational risks and boost ROI. Recurring Revenue Opportunities: You can offer ongoing data analysis, map updates, or subscription-based map access services. Low Overhead with Scalable Potential: With the right software and skills, you can serve clients globally from a single location. 2. Remote Sensing: Unlocking Data from a Distance Remote sensing is a cutting-edge GIS service that allows you to collect, process, and interpret data about the Earth’s surface without physical contact. Using satellites, aerial sensors, and drones, remote sensing captures imagery and environmental data across large areas with incredible accuracy and speed. This technology enables professionals to monitor and assess landscapes, ecosystems, and urban areas from a distance, making it ideal for hard-to-reach, dangerous, or expansive regions. Remote sensing can detect changes over time—such as deforestation, urban sprawl, crop health, or water pollution—using multispectral, hyperspectral, or thermal imaging. Key Applications of Remote Sensing in 2025: 🛰️ Agriculture & Precision Farming: Analyze crop health, moisture levels, and soil conditions to increase yields and reduce input costs. 🌱 Environmental Monitoring: Track forest degradation, coastal erosion, air quality, and wildlife habitats to support conservation efforts. 🏙️ Urban Development: Monitor land use changes, infrastructure growth, and construction projects for smarter urban planning. 🌊 Disaster Management: Detect early signs of natural disasters like floods, wildfires, and droughts—enabling faster response and mitigation. 🛢️ Mining & Oil Exploration: Identify resource-rich zones and monitor compliance with environmental regulations from above. Remote sensing is often combined with GIS software to create dynamic visualizations and analytical models that empower decision-makers across public and private sectors. Popular tools in this space include Google Earth Engine, Sentinel Hub, Planet Labs, ENVI, and DroneDeploy. 💡 Why it makes you rich: 🌍 High-Value Clients: Governments, NGOs, and large enterprises require remote sensing services for large-scale projects and compliance monitoring. 📈 Scalable Business Model: With cloud-based image processing and AI-powered analytics, one small team can manage vast areas of land or infrastructure. 🚁 Rising Demand for Drones: In 2025, drone-based data capture is a booming market. By offering drone surveying, you can charge premium rates with low operating costs. 🔁 Subscription & Retainer Models: Offer ongoing monitoring, monthly reports, or real-time alerts as part of a recurring service package. 3. Application Software Development: Build and Sell Custom GIS Tools In the rapidly evolving GIS landscape of 2025, application software development is one of the most lucrative avenues. At the heart of modern mapping and spatial analysis lies custom software—tools built to serve specific industries, solve unique spatial challenges, and offer seamless user experiences on web, desktop, and mobile platforms. Whether it’s a drone fleet management dashboard, a smart property listing map, or an agricultural land assessment app, businesses are looking for tailored GIS solutions that work faster, smarter, and on the go. As a developer, you can build powerful, industry-specific GIS applications using popular technologies like: Leaflet.js, Mapbox, or OpenLayers (for interactive mapping) PostGIS or Spatialite (for spatial databases) React, Vue, or Angular (for web interfaces) Python or Node.js (for backend processing) Cloud platforms like AWS, Azure, and Google Cloud (for scalability) Key Use Cases for GIS Application Development: 🏘️ Real Estate Mapping Platforms: Interactive maps showing nearby schools, zoning, plot boundaries, and property value heatmaps. 🚛 Logistics & Fleet Tracking Apps: Real-time vehicle monitoring, route optimization, and geofencing alerts. 🛢️ Oil & Gas Asset Monitoring Tools: Mapping pipelines, remote sites, and environmental compliance areas. 🌿 Agritech Apps: Field monitoring, yield estimation, and predictive analytics using spatial data. 🏢 Smart City Dashboards: Integrated GIS solutions for utilities, waste management, traffic control, and urban planning. Unlike general-purpose tools, custom GIS apps solve highly targeted problems, allowing you to charge premium development fees or offer subscription-based models. 💡 Why it makes you rich: 💸 Recurring Revenue with SaaS: Develop once and monetize over time with monthly or annual subscriptions. 🧩 High Demand for Customization: Businesses often need integrations with internal systems like CRMs, ERPs, or IoT sensors—which means ongoing development contracts. 🌐 Global Market Reach: Cloud-based GIS software allows you to serve clients across industries and geographies without physical boundaries. 🤝 White-label Opportunities: Sell … Read more

Top 25 GIS Research Ideas for 2025

GIS Research Ideas

Geographic Information Systems (GIS) continue to revolutionize various industries, from environmental conservation to urban planning. As technology advances, researchers are exploring new ways to leverage GIS for data analysis, predictive modeling, and sustainability. If you are looking for innovative GIS research topics for 2025, here are the top 10 ideas that can make a significant impact: Top 25 GIS Research Ideas Here are listed top 25+ GIS Research Idea for 2025: 1. GIS for Climate Change Analysis Climate change is a pressing global issue, and GIS plays a crucial role in assessing its impacts on different ecosystems. Researchers can use GIS to analyze temperature variations, predict extreme weather patterns, and develop mitigation strategies for climate resilience. 2. Urban Heat Island Mapping With rapid urbanization, cities are experiencing increased temperatures due to the heat island effect. Using GIS, researchers can map and analyze urban heat islands (UHIs), identify high-risk zones, and propose green infrastructure solutions to reduce heat stress. 3. Flood Risk Assessment Using GIS Flooding remains a major threat to many regions worldwide. GIS and remote sensing can help researchers predict flood-prone areas, analyze historical flood data, and develop disaster mitigation strategies for better preparedness. 4. GIS in Sustainable Urban Planning Smart city development relies on data-driven urban planning. GIS can optimize land use, enhance transportation networks, and ensure sustainable infrastructure development while minimizing environmental degradation. Related Content: 16 Best GIS YouTube Channels to Learn and Stay Updated 20 Best Remote Sensing Software for Professionals 10 Best Free LiDAR Software Tools and Viewers 5. Spatio-Temporal Analysis of Population Growth Demographic shifts significantly impact urban development and resource allocation. GIS-based spatio-temporal analysis can help researchers track population growth, migration trends, and urban expansion, leading to better policy decisions. 6. Groundwater Mapping Using GIS Water scarcity is a growing concern worldwide. GIS tools can be used to analyze groundwater availability, predict water distribution, and identify suitable locations for water conservation projects. 7. Soil Erosion Mapping with GIS Soil erosion affects agriculture, water quality, and land stability. Using GIS, researchers can predict soil erosion-prone areas, assess land degradation, and implement soil conservation measures to protect agricultural productivity. 8. Remote Sensing for Forest Monitoring Deforestation and forest degradation are major environmental threats. GIS and remote sensing technologies can be used to monitor forest cover changes, track illegal logging activities, and support reforestation efforts. 9. GIS in Crime Pattern Analysis Law enforcement agencies are increasingly relying on GIS for crime mapping and predictive analysis. Researchers can study crime trends, identify high-crime areas, and propose data-driven strategies for improving public safety. 10. GIS in Oil Spill Detection and Management Oil spills have devastating effects on marine ecosystems. GIS can assist in detecting oil spills, tracking their movement, and developing effective response strategies to minimize environmental damage. 11. Geospatial Analysis of Renewable Energy Sites As the world shifts towards sustainable energy, GIS plays a crucial role in identifying optimal locations for wind farms and solar power plants. Researchers can analyze terrain, climate conditions, and land suitability to maximize energy production while minimizing environmental impact. 12. GIS for Coastal Zone Management Coastal areas are highly vulnerable to erosion, flooding, and climate change. GIS can help researchers assess coastal changes, monitor shoreline dynamics, and develop conservation strategies to protect marine ecosystems and coastal communities. 13. GIS and Green Infrastructure Green infrastructure, such as parks, green roofs, and urban forests, is essential for sustainable urban development. GIS can be used to design and optimize these spaces, enhancing environmental benefits like air quality improvement and stormwater management. 14. 3D GIS and Urban Modeling The integration of 3D GIS is transforming city planning and disaster risk assessment. Researchers can use 3D models to simulate urban expansion, analyze infrastructure resilience, and plan for smart cities. 15. Land Use/Land Cover Change Detection Monitoring land use and land cover (LULC) changes is crucial for environmental sustainability. GIS and remote sensing can track deforestation, urban sprawl, and agricultural expansion, providing insights for land management policies. 16. GIS and Archaeological Mapping Archaeologists are increasingly using GIS to map and analyze ancient sites. GIS can help in identifying potential excavation locations, studying historical landscapes, and preserving cultural heritage sites. 17. Mapping Socio-Economic Inequality GIS can be a powerful tool for visualizing economic disparities across different regions. Researchers can analyze income distribution, access to healthcare, and education levels, leading to more effective policymaking and resource allocation. 18. GIS for Cultural Heritage Preservation Many historical sites face threats from urbanization, natural disasters, and climate change. GIS can assist in mapping and documenting cultural heritage locations, enabling better conservation and restoration efforts. 19. GIS in Agricultural Productivity Precision agriculture relies heavily on GIS for analyzing soil health, crop yields, and irrigation patterns. Researchers can use GIS to optimize farming practices, improve food security, and promote sustainable agriculture. 20. GIS in Water Resource Management With increasing water scarcity, GIS is essential for tracking water availability, mapping watersheds, and planning efficient water management strategies. This research can help ensure sustainable water use for agriculture, industry, and households. 21. Spatial Analysis of Air Quality Air pollution is a major health and environmental concern globally. By integrating GIS with remote sensing data, researchers can monitor pollution sources, analyze air quality trends, and identify high-risk zones. This helps policymakers implement effective mitigation strategies and improve public health outcomes. Research Tip: Combine satellite data (like Sentinel-5P) with local sensor readings for high-resolution mapping. 22. GIS in Environmental Impact Assessment (EIA) Environmental Impact Assessments are crucial for sustainable development. GIS can streamline the EIA process by modeling how proposed projects (like highways, dams, or industries) may affect ecosystems. Researchers can visualize potential impacts, compare scenarios, and support decision-makers in choosing the least harmful development path. Why It Matters: With rapid infrastructure growth, EIAs using GIS can ensure responsible development. 23. Forest Fire Risk Mapping As climate change intensifies, forest fires are becoming more frequent and destructive. GIS can model fire-prone zones by analyzing historical data, vegetation type, slope, and weather patterns. This research is vital for early … Read more

20 Best Remote Sensing Software for Professionals

Remote Sensing Software

Remote sensing has become a critical tool in various industries, including environmental monitoring, agriculture, urban planning, and disaster management. With advancements in technology, numerous remote sensing software solutions are available to process, analyze, and visualize satellite and aerial imagery. This article lists the 20 best remote sensing software tools that professionals can use for their geospatial and earth observation needs. 20 Best Remote Sensing Software Here’s a list of 20 Best Remote Sensing Software for Professionals you can start using today: 1. Google Earth Engine Platform: Web-based Key Features: Cloud computing, vast data catalog, AI/ML integration Google Earth Engine (GEE) is a cloud-based platform that provides access to a vast repository of geospatial datasets and remote sensing tools. It supports advanced analytics, machine learning, and data visualization. Users can leverage its computational power to analyze massive amounts of satellite imagery, making it ideal for large-scale environmental and climate studies. 2. ArcGIS Pro Platform: Windows Key Features: Advanced spatial analysis, 3D visualization, deep integration with GIS ArcGIS Pro by Esri is one of the most powerful remote sensing software tools. It supports raster analysis, geostatistics, and integration with AI models for enhanced imagery interpretation. The software enables users to conduct high-precision spatial analysis, overlay multiple datasets, and integrate real-time data streams. 3. QGIS Platform: Windows, macOS, Linux Key Features: Open-source, plugin support, raster and vector analysis QGIS is a widely used open-source GIS software that supports remote sensing tasks through plugins like the Semi-Automatic Classification Plugin (SCP) for image classification. It allows for extensive customization and scripting using Python, making it a versatile tool for research and academic purposes. 4. ERDAS IMAGINE Platform: Windows Key Features: AI-driven classification, photogrammetry, LiDAR analysis ERDAS IMAGINE is a leading software for raster-based remote sensing, supporting high-level geospatial analytics and machine learning. It excels in photogrammetry, 3D terrain modeling, and satellite image analysis, making it a preferred choice for professionals in urban planning and land-use management. 5. ENVI Platform: Windows Key Features: Hyperspectral analysis, SAR processing, AI integration ENVI is a premier tool for remote sensing professionals, particularly for analyzing hyperspectral and synthetic aperture radar (SAR) data. It includes robust tools for automated feature extraction, atmospheric correction, and multi-temporal analysis, helping researchers derive meaningful insights from satellite and aerial imagery. 6. SNAP (Sentinel Application Platform) Platform: Windows, macOS, Linux Key Features: Multi-mission support, free Sentinel data processing Developed by ESA, SNAP provides advanced processing capabilities for Sentinel satellite data, making it essential for earth observation applications. The software offers pre-processing tools for SAR and optical imagery, allowing users to conduct sophisticated atmospheric corrections and vegetation indices analysis. 7. GRASS GIS Platform: Windows, macOS, Linux Key Features: Open-source, raster processing, hydrology tools GRASS GIS is an open-source powerhouse for geospatial and remote sensing analysis, offering extensive raster processing and statistical analysis tools. It supports topographic modeling, spatial interpolation, and change detection analysis, making it a favorite among environmental scientists and hydrologists. 8. PCI Geomatica Platform: Windows Key Features: AI-based object recognition, photogrammetry, atmospheric correction PCI Geomatica is a feature-rich remote sensing software that supports multi-sensor image processing and AI-based classification. It includes tools for advanced radar analysis, mosaicking, and automated feature detection, making it invaluable for mapping and disaster response planning. 9. Global Mapper Platform: Windows Key Features: LiDAR processing, terrain analysis, 3D visualization Global Mapper is a cost-effective tool for remote sensing applications, supporting LiDAR and terrain modeling. It includes powerful tools for contour generation, watershed analysis, and volumetric calculations, catering to professionals in forestry and mining. 10. Orfeo ToolBox (OTB) Platform: Windows, macOS, Linux Key Features: Open-source, large-scale processing, machine learning support OTB is a high-performance remote sensing toolbox known for its ability to handle large datasets efficiently. It features automated image classification, segmentation, and object recognition using AI algorithms. Related Content:  10 Best Free LiDAR Software Tools and Viewers The Best 15 Google Maps Scrapers of 2025 Top 10 GIS Software: Features, Benefits, and Comparisons 11. ILWIS (Integrated Land and Water Information System) Platform: Windows Key Features: Open-source, raster and vector processing, hydrological modeling ILWIS is a powerful remote sensing software known for its strong GIS and image processing capabilities. It is widely used in hydrology, agriculture, and land management applications. It supports various geospatial data formats and provides robust analytical tools for spatial modeling and map visualization. 12. eCognition Platform: Windows Key Features: Object-based image analysis, machine learning integration eCognition is a leading software for object-based image classification, supporting AI-driven analysis for land cover mapping and feature extraction. It is widely used in precision agriculture, forestry management, and urban planning, thanks to its ability to analyze complex imagery efficiently. 13. GEOimage Platform: Windows Key Features: SAR and optical data processing, AI-powered classification GEOimage is a specialized tool for satellite and drone imagery analysis, commonly used for defense and environmental monitoring applications. It provides advanced filtering and image enhancement techniques for improved feature recognition and land-use planning. 14. SAGA GIS Platform: Windows, macOS, Linux Key Features: Open-source, geostatistical analysis, terrain modeling SAGA GIS is known for its powerful geostatistical and topographic analysis tools, making it useful for climate modeling and hydrology. It includes extensive capabilities for terrain analysis, hydrological modeling, and landform classification. 15. GEOID Platform: Windows Key Features: 3D geospatial visualization, terrain analysis GEOID is an advanced remote sensing software for digital elevation modeling and geospatial visualization. It provides high-resolution 3D visualization tools, making it ideal for geological and environmental studies. 16. Whitebox GAT Platform: Windows, macOS, Linux Key Features: Open-source, LiDAR processing, hydrological tools Whitebox GAT is an emerging tool in remote sensing, focusing on terrain analysis and LiDAR data interpretation. It is commonly used for environmental modeling, landform analysis, and water resource management. 17. SuperGIS Platform: Windows Key Features: Spatial analysis, remote sensing, GIS integration SuperGIS provides an alternative to ArcGIS with strong remote sensing support. It includes real-time mapping, GPS integration, and spatial data analysis tools. 18. DIPEx Platform: Windows Key Features: AI-enhanced image processing, object recognition DIPEx is used for advanced image classification and feature extraction, supporting deep … Read more

How GIS Users Use DeepSeek AI: Transforming Spatial Analysis with AI-Powered Insights

DeepSeek AI

Geographic Information Systems (GIS) have revolutionized the way we analyze spatial data. However, as data complexity increases, GIS professionals are turning to AI-powered tools like DeepSeek AI to streamline processes, enhance accuracy, and uncover hidden patterns in geospatial data. This blog explores how GIS users leverage DeepSeek AI to optimize workflows and make data-driven decisions. What is DeepSeek AI? DeepSeek AI is an advanced artificial intelligence model designed to handle complex data analysis tasks, including geospatial data processing. It utilizes deep learning, natural language processing (NLP), and predictive analytics to assist GIS professionals in extracting meaningful insights from vast datasets. Key Ways GIS Users Utilize DeepSeek AI 1. Automated Data Classification GIS professionals often work with large datasets containing diverse land types, vegetation patterns, and urban structures. DeepSeek AI can classify satellite imagery and LiDAR data with high accuracy, reducing manual work and increasing efficiency. 2. Enhancing Spatial Data Analysis DeepSeek AI processes spatial data faster by identifying patterns, correlations, and anomalies that traditional GIS tools might miss. Whether detecting deforestation trends or analyzing urban heat islands, AI-driven insights enable more precise decision-making. 3. Improving Remote Sensing Analysis Remote sensing generates vast amounts of satellite imagery that require extensive processing. DeepSeek AI enhances image segmentation, object detection, and change detection, making it easier for GIS users to monitor land use changes and natural disasters. 4. Predictive Geospatial Modeling DeepSeek AI aids in predictive modeling by analyzing historical geospatial data to forecast future trends. This is particularly useful in urban planning, environmental conservation, and disaster risk assessment. 5. Automating Geospatial Queries with NLP GIS users can interact with DeepSeek AI using natural language queries, eliminating the need for complex SQL or Python scripts. For example, a user can ask, “What areas have experienced the most urban expansion in the last decade?“ and receive precise results instantly. 6. Enhancing Geospatial Big Data Processing With the increasing volume of geospatial big data, DeepSeek AI assists in handling large datasets efficiently. By integrating AI with GIS platforms like ArcGIS or QGIS, users can perform real-time analysis on extensive datasets without performance bottlenecks. 7. Optimizing Route Planning & Logistics DeepSeek AI aids in transportation and logistics by analyzing road networks, traffic patterns, and optimal route planning. This helps in supply chain management, emergency response, and smart city development. 8. Disaster Management & Risk Assessment DeepSeek AI processes real-time disaster data, predicts risk zones, and suggests optimal evacuation routes. This is invaluable for disaster response teams and urban planners working to mitigate the impact of natural calamities. Integration of DeepSeek AI with GIS Software DeepSeek AI can be integrated with leading GIS software such as: Esri ArcGIS – for automated spatial analysis and predictive modeling. QGIS – for AI-assisted open-source GIS workflows. Google Earth Engine – for advanced remote sensing and environmental monitoring. Conclusion DeepSeek AI is transforming the GIS industry by automating tedious tasks, improving spatial analysis accuracy, and providing predictive insights. By integrating AI-driven solutions, GIS professionals can make faster, data-driven decisions and unlock the full potential of geospatial technology. Are you ready to enhance your GIS workflows with AI? Start exploring DeepSeek AI today! Frequently Asked Questions (FAQ) Q: How does DeepSeek AI improve GIS workflows? Ans: DeepSeek AI automates classification, enhances spatial analysis, and enables predictive modeling, reducing manual effort and improving accuracy. Q: Can DeepSeek AI be used with open-source GIS software? Ans: Yes, DeepSeek AI can integrate with open-source GIS tools like QGIS to assist in spatial analysis and data processing. Q: What industries benefit from using DeepSeek AI in GIS? Ans: Industries such as urban planning, environmental conservation, disaster management, transportation, and agriculture benefit from AI-powered GIS analysis. Q: How does DeepSeek AI handle large geospatial datasets? Ans: DeepSeek AI efficiently processes geospatial big data by leveraging deep learning and cloud computing to handle vast amounts of spatial information. Q: Does DeepSeek AI require programming knowledge to use? Ans: No, DeepSeek AI supports natural language processing (NLP), allowing users to interact using simple queries without requiring advanced programming skills.