How GIS is Revolutionizing Irrigation Planning in Dry Regions [2025]

Irrigation

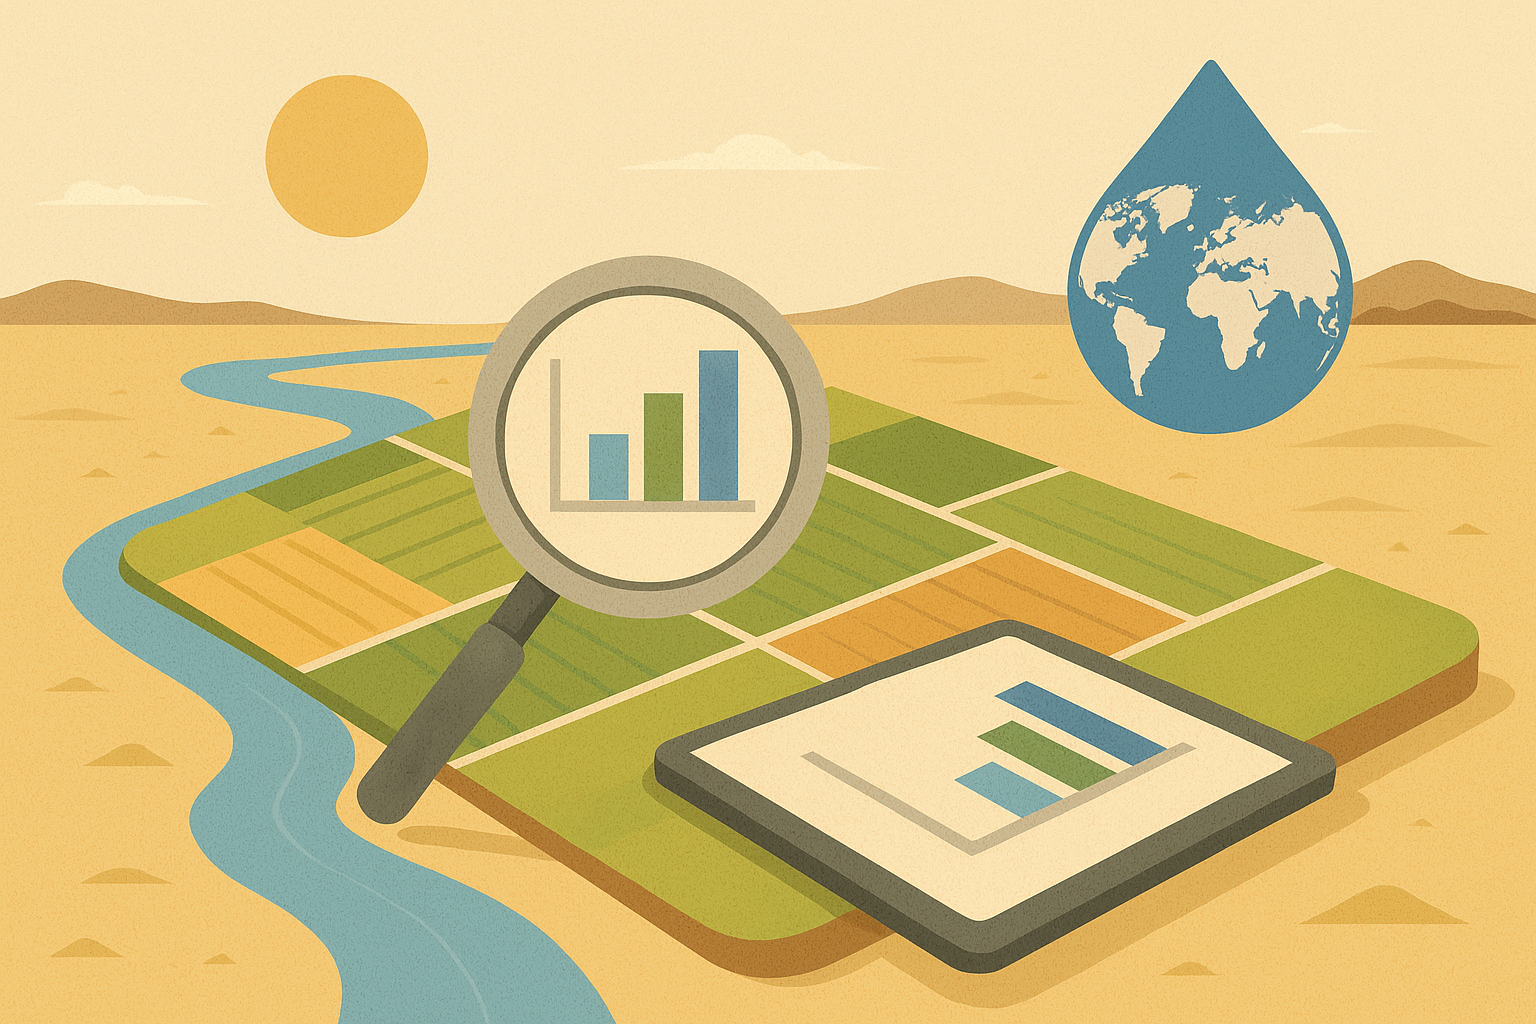
Practical Examples from Arid/Semi-Arid Zones Using Water Efficiency In water-scarce areas, especially arid and semi-arid regions, efficient irrigation is not just a choice—it’s a necessity. Geographic Information Systems (GIS) are playing a transformative role in modern irrigation planning, helping farmers and planners make informed, data-driven decisions to optimize water usage, increase crop productivity, and ensure sustainability. In this blog post, we explore how GIS technology is revolutionizing irrigation planning in dry regions, with real-world examples and practical applications. What is GIS and Why is it Important for Irrigation? GIS (Geographic Information System) is a powerful tool that captures, stores, analyzes, and visualizes spatial data. In irrigation planning, GIS integrates satellite imagery, climate data, soil maps, and topographic information to help determine: Where water is most needed How water can be delivered efficiently What crops are best suited to specific micro-zones How much water is needed at different times Challenges in Irrigation Planning in Dry Regions Dry regions often face: Low and erratic rainfall High evaporation rates Saline or degraded soils Limited groundwater resources Traditional irrigation planning in such regions can result in water wastage, poor crop yields, and land degradation. That’s where GIS changes the game. How GIS Helps in Smart Irrigation Planning 1. Identifying Suitable Cropping Zones GIS can combine layers of soil texture, slope, and climate data to classify land into zones most suitable for certain crops. This prevents farmers from growing water-intensive crops in unsuitable areas. Example:In Rajasthan, India, GIS tools helped identify suitable areas for less water-intensive crops like millet and pulses, replacing water-thirsty sugarcane and saving millions of liters of water annually. 2. Designing Efficient Irrigation Networks By analyzing topography and elevation data, GIS supports the design of gravity-fed irrigation systems that reduce the need for pumps and conserve energy. Example:In the Mekelle region of Ethiopia, GIS mapping helped in designing contour-based irrigation channels that reduced runoff and increased water retention in the soil. 3. Monitoring Crop Health and Water Stress With remote sensing data, GIS can detect NDVI (Normalized Difference Vegetation Index) to assess crop health and identify areas under water stress, enabling timely interventions. Example:In southern California, GIS-based NDVI analysis allowed almond farmers to adjust irrigation zones based on real-time plant stress levels, leading to a 20% increase in water-use efficiency. 4. Groundwater Mapping and Recharge Planning GIS helps identify aquifer zones, groundwater recharge areas, and over-extraction hotspots, supporting better regulation and sustainable use of underground water. Example:In Baluchistan, Pakistan, GIS-supported groundwater mapping helped install tubewells in sustainable zones while avoiding overexploited aquifers, reducing long-term water table decline. Related Content: Land Suitability Analysis for Agriculture Using GIS: Methods & Case Studies Top 5 GIS Projects to Improve Food Security in Developing Countries How to Use QGIS for Precision Farming: A Beginner’s Guide 5. Precision Irrigation and Drip System Design GIS allows for precision agriculture where drip irrigation lines are placed based on soil type, plant spacing, and slope, ensuring water reaches the roots without waste. Example:In Israel’s Negev Desert, GIS-guided drip irrigation systems have helped grow vegetables and fruits with up to 40% less water compared to conventional methods. Benefits of Using GIS in Irrigation for Dry Regions ✔ Optimized water use✔ Improved crop yields✔ Lower input costs (fertilizer, energy, water)✔ Reduced land degradation✔ Better climate resilience SEO Keywords to Remember: GIS in irrigation planning Smart irrigation in arid zones Water efficiency with GIS GIS agriculture applications Precision farming in dry regions GIS for sustainable water use Final Thoughts GIS is no longer a futuristic concept—it’s a practical and powerful solution for farmers and planners dealing with water scarcity in dry regions. From designing efficient irrigation networks to selecting suitable crops and detecting water stress, GIS empowers decision-making like never before. As climate change continues to challenge water availability, embracing GIS in irrigation planning isn’t just smart—it’s essential. Frequently Asked Questions (FAQs) 1. How does GIS help in irrigation planning? Answer: GIS helps in irrigation planning by analyzing spatial data such as soil type, topography, rainfall patterns, and crop suitability. This allows planners to design efficient irrigation systems, reduce water waste, and improve crop productivity, especially in arid and semi-arid regions. 2. Can GIS improve water efficiency in agriculture? Answer: Yes. GIS enables precision agriculture by identifying zones of water stress, designing accurate drip irrigation systems, and recommending crops that require less water—resulting in significantly improved water-use efficiency. 3. Is GIS cost-effective for small-scale farmers? Answer: Initially, GIS implementation may require investment, but many governments and NGOs now offer GIS-based tools and services at low or no cost. Over time, farmers benefit from reduced water bills, increased yield, and optimized resource use, making it highly cost-effective. 4. Which regions have successfully implemented GIS for irrigation? Answer: Regions like Rajasthan (India), Negev Desert (Israel), Baluchistan (Pakistan), and Southern California (USA) have successfully implemented GIS for smart irrigation planning, resulting in substantial water savings and increased crop yields. 5. What kind of data does GIS use for irrigation planning? Answer: GIS uses various data types including: Satellite imagery Soil maps Rainfall and temperature data Land slope and elevation models Vegetation indices like NDVI These datasets are layered and analyzed to support informed decision-making.
Land Suitability Analysis for Agriculture Using GIS: Methods & Case Studies [2025]

Land Suitability Analysis for Agriculture Using GIS

Land Suitability Analysis for Agriculture Using GIS: Methods & Case Studies perfect for Professional GIS Users. In an era of rapid population growth and increasing pressure on land resources, ensuring sustainable agricultural productivity is more important than ever. Land Suitability Analysis (LSA) using Geographic Information Systems (GIS) offers a modern and scientific approach to identifying the most appropriate areas for agriculture. This powerful tool supports soil scientists, agronomists, and land use planners in making data-driven decisions for sustainable land management. In this blog post, we’ll explore: What is Land Suitability Analysis? Why use GIS in Land Suitability Assessment? Key Methods and Criteria in GIS-based LSA Case Studies from around the world Applications in soil science and land use planning What is Land Suitability Analysis? Land Suitability Analysis is the process of evaluating a piece of land to determine its fitness for a specific type of land use—in this case, agriculture. It involves comparing land characteristics (soil type, slope, rainfall, temperature, etc.) against the requirements of different crops. Traditionally, this was done manually, but modern GIS technologies now allow for more accurate, faster, and spatially detailed assessments. Why Use GIS for Land Suitability? GIS brings several advantages to the table: 📍 Spatial Accuracy: Ability to map and analyze large areas with high precision. 📊 Data Integration: Combines multiple layers like soil maps, topography, climate, and land cover. ⚡ Speed & Efficiency: Reduces time and labor required in traditional field assessments. 🎯 Decision Support: Provides visual and analytical tools to guide sustainable agricultural development. Methods of Land Suitability Analysis for Agriculture Using GIS There are several standard methods used in Land Suitability Analysis for Agriculture Using GIS. These include: 1. FAO Framework The FAO (Food and Agriculture Organization) developed a comprehensive and standardized framework for evaluating land suitability, which remains one of the most widely adopted methodologies worldwide. This framework assesses land based on how well it can support a specific type of land use—most commonly agricultural production. FAO Suitability Classes: The classification divides land into five main categories: S1 – Highly SuitableThe land has no or only minor limitations for the intended use. It can produce high yields with minimal inputs and is ideal for sustainable agriculture. S2 – Moderately SuitableThe land has some limitations (e.g., less optimal soil texture, slight slope, or moderate climate variation) that may reduce productivity or require moderate inputs like irrigation or fertilizers. S3 – Marginally SuitableThe land has significant limitations that limit productivity. Crop yields may be lower, and it may require major improvements or input for viable farming. N1 – Currently Not SuitableThe land is not suitable under present conditions, but could be made usable through significant investments or land improvements like drainage, soil amendment, or terracing. N2 – Permanently Not SuitableThe land has limitations that are either too severe or impractical to overcome. Examples include rocky terrains, extremely steep slopes, or highly saline soils. How GIS Enhances the FAO Framework GIS technology plays a crucial role in implementing this framework at scale. Here’s how: Spatial Analysis: GIS can map suitability classes across entire regions using soil, topography, and climate data. Data Integration: Layers such as rainfall, soil pH, land cover, and elevation can be overlaid and analyzed simultaneously. Visualization: The output is often presented as a Land Suitability Map, showing areas classified from S1 to N2, enabling easier interpretation for planners and stakeholders. Decision Support: Governments, NGOs, and agricultural investors can use GIS-generated suitability maps for zoning, irrigation planning, and sustainable land management. 2. Multi-Criteria Evaluation (MCE) Multi-Criteria Evaluation (MCE) is a powerful decision-making approach used in GIS to evaluate land suitability by considering multiple environmental, physical, and socio-economic factors. It is especially valuable when no single factor can determine land suitability, and a combination of variables must be assessed simultaneously. At the heart of MCE lies the Weighted Overlay Analysis—a spatial analysis technique where each criterion is given a specific importance (weight) and then overlaid to create a composite suitability map. How MCE Works in GIS: Selection of Criteria (Factors):The first step is to identify the key factors affecting land suitability for a particular crop or land use. Common criteria include: Soil pH – Influences nutrient availability and crop growth. Drainage – Affects water retention and root development. Rainfall – Determines water availability, essential for crop productivity. Slope – Influences erosion risk and ease of mechanized farming. Standardization of Data:All input layers are converted to a common scale, usually from 0 (unsuitable) to 1 (highly suitable), to ensure comparability. This process is essential because the original data might be in different units (e.g., mm for rainfall, % for slope). Assigning Weights to Each Factor:Each criterion is assigned a weight based on its relative importance to the target land use. For instance, rainfall may be given 40% weight for rice cultivation, while soil pH might receive 30%. Weighted Overlay Analysis:The standardized and weighted layers are combined using raster math in the GIS environment. The resulting output is a suitability map, which visually represents the degree of suitability of each area. Classification of Results:The output is typically classified into categories such as: Highly Suitable Moderately Suitable Marginally Suitable Unsuitable Tools Commonly Used for MCE ArcGIS Weighted Overlay Tool QGIS Raster Calculator & SAGA/GRASS plugins IDRISI’s Decision Support Module Advantages of MCE Flexible and customizable – Criteria and weights can be tailored to specific crops or regions. Integrates expert knowledge – Local agricultural experts can help define appropriate weights. Transparent process – Easy to document and justify each step in decision-making. Related Content: How to Use QGIS for Precision Farming: A Beginner’s Guide 10 Emerging Trends in Geospatial Technology for Agriculture Top 10 GIS-Based Dissertation Topics for Agricultural Students 3. Analytic Hierarchy Process (AHP) The Analytic Hierarchy Process (AHP) is an advanced, structured decision-making technique that is often used within Multi-Criteria Evaluation (MCE) frameworks. Developed by Thomas L. Saaty, AHP provides a systematic and mathematical way to assign weights to various factors based on their relative importance—using pairwise comparisons. Unlike arbitrary or expert-driven weighting … Read more

How to Use QGIS for Precision Farming: A Beginner’s Guide [2025]

QGIS for Precision Farming

Precision farming is revolutionizing agriculture in 2025, helping farmers maximize yield while minimizing input costs and environmental impact. One of the most powerful — and free — tools enabling this transformation is QGIS (Quantum GIS). In this beginner-friendly guide, you’ll learn how to use QGIS for precision farming, from installing the software to analyzing satellite imagery, creating field maps, and making informed decisions using real spatial data. What is QGIS and Why Use It for Precision Farming? QGIS is an open-source Geographic Information System (GIS) software that allows you to visualize, manage, analyze, and map spatial data. In the context of precision farming, QGIS can help with: Mapping farm boundaries and crop zones Analyzing NDVI (Normalized Difference Vegetation Index) for crop health Planning irrigation and fertilizer application Monitoring yield and predicting productivity Step-by-Step Guide: Using QGIS for Precision Farming Step 1: Install QGIS (Latest Version) Visit the official QGIS website: https://qgis.org Download the Long-Term Release (LTR) for your OS (Windows/Mac/Linux). Follow installation instructions. Launch the QGIS Desktop Application. Step 2: Add Base Maps and Farm Boundary Go to ‘Plugins > Manage and Install Plugins’. Search and install ‘QuickMapServices’. Add base maps (e.g., Google Satellite) using: Web > QuickMapServices > Google > Google Satellite To add your farm boundary: Layer > Create Layer > New Shapefile Layer (Polygon) Digitize your farm field by tracing on the satellite image. 📝 Tip: Save your layers regularly as .shp or .geojson. Step 3: Add Soil or Crop Data (CSV or Shapefile) If you have soil test results or crop yield data in Excel: Save as .CSV with coordinates (latitude, longitude). Go to Layer > Add Layer > Add Delimited Text Layer. Select your file and assign the correct X (longitude) and Y (latitude). Click ‘Add’ to plot your data on the map. 📌 Use different symbols/colors to represent soil pH, nitrogen levels, or yield rates. Related Content:  10 Emerging Trends in Geospatial Technology for Agriculture Top 10 GIS-Based Dissertation Topics for Agricultural Students 10 Innovative Ways Farmers Are Using GIS in 2025 Step 4: Import and Analyze NDVI for Crop Health Download free NDVI imagery from: Sentinel Hub USGS Earth Explorer In QGIS, go to Raster > Add > Add Raster Layer. Load the NDVI image (usually .tif format). Apply Color Stretching for visualization: Right-click on the layer > Properties > Symbology > Render as Singleband pseudocolor. 🌾 NDVI values range from -1 to +1: 0.2 – 0.5: Stressed vegetation 0.6 – 0.9: Healthy crops Step 5: Create a Fertilizer or Irrigation Map Use ‘Raster Calculator’ under Raster > Raster Calculator. Apply logic like: perl CopyEdit (“NDVI@1” < 0.4) * 1 + (“NDVI@1” >= 0.4 AND “NDVI@1” <= 0.6) * 2 + (“NDVI@1” > 0.6) * 3 1 = High input needed 2 = Medium 3 = Low input needed Export this as a new raster layer. Convert to vector zones (optional): Raster > Conversion > Polygonize 🧮 This helps you apply inputs only where needed, saving cost and reducing waste. Read More: 7 Powerful GIS Applications in Agriculture Step 6: Generate Printable Field Maps Go to Project > New Print Layout. Add Map, Legend, North Arrow, and Scale. Export as PDF or Image to share with farm workers or agronomists. Bonus: Useful QGIS Plugins for Farmers (2025) Plugin Name Purpose DZetsaka Advanced classification for land cover Semi-Automatic Classification Plugin (SCP) Process satellite images easily Field Calculator Perform spatial calculations QField Sync Sync field data with QField mobile app Read More: GIS Software Development: A Complete Roadmap for 2025 Real-World Use Case: How One Farmer Improved Yield by 30% Ravi, a wheat farmer in India, used QGIS to: Map his land, Analyze NDVI from Sentinel-2, Identify underperforming zones, Apply targeted urea and irrigation. Result: 30% increase in yield and 25% reduction in fertilizer use. Conclusion Precision farming doesn’t need expensive equipment or software. With QGIS, any farmer or agricultural consultant can start using geospatial data for smarter decision-making. As we move further into 2025, integrating GIS into agriculture is not just a trend — it’s a necessity. Frequently Asked Questions (FAQs) Q1. Is QGIS free for farmers?Yes, QGIS is 100% free and open-source. Q2. Can I use QGIS on my phone?Not directly, but you can use QField (Android/iOS) to collect field data and sync with QGIS on your PC. Q3. Where can I get free satellite data?Use sources like Sentinel Hub, Copernicus Open Access Hub, or Earth Explorer.

Top 10 GIS-Based Dissertation Topics for Agricultural Students

GIS-Based Dissertation Topics

Ideal for university students looking for impactful research areas Geographic Information Systems (GIS) have revolutionized modern agriculture by enabling precise mapping, spatial analysis, and informed decision-making. For agricultural students, incorporating GIS into their dissertation not only boosts academic value but also opens up career opportunities in agri-tech, sustainability, and land management sectors. In this post, we’ll explore the top 10 GIS-based dissertation topics that are highly relevant, researchable, and impactful in the agricultural domain. 10 GIS-Based Dissertation Topics for Agricultural Students 1. Precision Farming Using GIS and Remote Sensing Precision farming, also known as precision agriculture, is a cutting-edge approach that leverages GIS (Geographic Information Systems) and remote sensing technologies to manage farming practices with pinpoint accuracy. This method enables farmers and researchers to collect, analyze, and act on vast amounts of spatial and temporal data related to crop health, soil conditions, and environmental variables. What Makes It a Great Dissertation Topic? GIS tools provide farmers with real-time mapping and spatial analysis, allowing them to: Identify variations in soil fertility across a field Monitor plant growth and crop health using NDVI (Normalized Difference Vegetation Index) Optimize the use of inputs such as fertilizers, pesticides, and water Increase overall crop yield while minimizing waste and environmental impact Remote sensing data—from satellites, drones, or UAVs—complements GIS by offering frequent and large-scale views of farm conditions. Together, they form the technological foundation of smart farming. Research Scope for Students A student pursuing this topic can explore: The integration of UAV/drone data with GIS for real-time decision-making Development of precision maps for site-specific nutrient management Case studies on yield prediction models using temporal satellite imagery Cost-benefit analysis of implementing GIS-based precision farming in small vs. large farms Real-World Applications Variable rate application (VRA) of fertilizers Irrigation scheduling based on soil moisture mapping Pest/disease forecasting using spatial disease spread models Zonal management based on micro-climatic conditions Tools & Technologies You Can Use QGIS / ArcGIS for spatial data processing and map generation Sentinel-2 or Landsat imagery for vegetation indices DroneDeploy or Pix4D for high-resolution aerial data OpenCV, Google Earth Engine for automated image analysis 2. Land Use and Land Cover (LULC) Changes and Their Impact on Agriculture Land Use and Land Cover (LULC) studies are essential for understanding how human activities and natural processes are transforming the earth’s surface. For agriculture, such changes directly influence the availability of arable land, soil quality, water resources, and ecosystem services. Using GIS and remote sensing, students can effectively assess these changes and analyze their long-term impacts on agricultural sustainability. Why Is This a Strong Dissertation Topic? With rapid urban expansion, deforestation, industrialization, and infrastructure development, agricultural lands are shrinking in many parts of the world. GIS and remote sensing tools allow for: Temporal analysis of land use transformation (e.g., farmland to urban or barren land) Quantification of agricultural land loss Identification of regions at risk for food insecurity Support for land-use planning and policy-making Potential Research Questions Students exploring this topic can focus on: How has urban sprawl impacted agricultural land in a specific region over the last 20 years? What is the relationship between LULC change and crop productivity in vulnerable zones? How do LULC transitions correlate with climate variables and water availability? Can GIS-based LULC change detection support better land management practices? Tools and Data Sources Landsat, MODIS, Sentinel satellite imagery for time-series analysis Supervised and unsupervised classification using tools like QGIS, ArcGIS, or Google Earth Engine Change detection algorithms such as NDVI difference, post-classification comparison, and image differencing Ground-truth data and field surveys for validation Real-World Applications Agricultural zoning and land-use regulation Supporting food security policies at local and national levels Predictive modeling of future land use changes Conservation planning for preserving fertile lands and natural habitats Case Study Ideas LULC changes in river basins and their effects on irrigation agriculture Urban expansion around peri-urban agricultural zones Shifting cultivation and deforestation in tropical regions 3. Drought Risk Mapping and Assessment in Agricultural Zones Drought is one of the most devastating natural hazards affecting agriculture. With climate change increasing the frequency and severity of droughts, understanding where and how they occur is critical for ensuring food security, sustainable farming, and risk mitigation. Through GIS modeling and remote sensing, students can develop spatial drought risk maps that highlight vulnerable agricultural zones and quantify their potential impacts on crop productivity. Why Is This a Valuable Dissertation Topic? Drought doesn’t just mean a lack of rain—it includes complex interactions between temperature rise, soil moisture loss, groundwater depletion, and evapotranspiration. By integrating these variables in a GIS environment, students can: Identify high-risk areas for agricultural drought Understand historical drought patterns using long-term data Recommend drought-resilient planning and mitigation strategies Potential Research Objectives Your research can focus on: Mapping agricultural drought-prone regions using Standardized Precipitation Index (SPI) or Vegetation Condition Index (VCI) Assessing soil moisture variability and crop stress across seasons Evaluating how climatic variables (rainfall, temperature) and land characteristics influence drought severity Developing a Drought Vulnerability Index (DVI) for specific crop zones Data and Tools You Can Use MODIS, Sentinel-2, and Landsat for vegetation health monitoring (NDVI, EVI) Climatic data from sources like CHIRPS, WorldClim, and IMD (rainfall, temperature) Soil and land-use data from national agriculture departments or FAO Tools like ArcGIS, QGIS, and Google Earth Engine for spatial analysis and modeling Practical Applications Informing irrigation planning and water resource allocation Supporting early warning systems and agricultural drought advisories Identifying zones for climate-resilient crop varieties Assisting governments in policy-making and resource prioritization Case Study Ideas Drought impact mapping in rainfed agricultural areas Comparison of drought trends before and after major climate events (e.g., El Niño) Spatial-temporal drought risk assessment in semi-arid or arid zones 4. Soil Fertility Mapping Using GIS for Site-Specific Nutrient Management Soil fertility plays a vital role in determining crop health, yield potential, and sustainable land use. By leveraging GIS tools to map the spatial variability of soil nutrients, pH levels, and organic matter, students can contribute to the development of site-specific nutrient management (SSNM) strategies—reducing … Read more

10 Innovative Ways Farmers Are Using GIS in 2025

Farmers Are Using GIS

In 2025, Geographic Information Systems (GIS) are more than just maps—they’re powerful decision-making tools reshaping how farmers manage land, resources, and sustainability. As climate change, food demand, and land scarcity pressurize agriculture, GIS is becoming the backbone of smart farming strategies. Here are 10 innovative ways farmers are using GIS in 2025, with real-world examples showing just how powerful this technology has become. 10 Innovative Ways Farmers Are Using GIS 1. Precision Farming with Real-Time Soil Monitoring In 2025, precision farming has reached new heights with the integration of GIS technology and advanced soil sensors. Farmers are now deploying real-time soil monitoring systems across their fields that continuously collect data on key parameters such as soil moisture, temperature, salinity, pH, and nutrient levels. These sensors feed information directly into GIS platforms, which process and visualize the data spatially to produce ultra-high-resolution soil maps. Unlike traditional soil tests that are periodic and localized, this approach allows for dynamic, up-to-the-minute insights into every square meter of farmland. By combining geolocation data, satellite imagery, and IoT-enabled soil sensors, farmers can see where the soil is too dry, too acidic, or lacking in specific nutrients—empowering them to take targeted actions rather than treating entire fields uniformly. Real-World Example: Netherlands’ Data-Driven Dairy Farms In the Netherlands—a leader in agricultural innovation—many dairy farmers have adopted GIS-integrated soil monitoring systems to enhance pasture management and fodder crop production. These systems track the soil’s nitrogen levels in real time, allowing for variable rate nitrogen application. That means farmers can apply precise amounts of fertilizer only where needed, down to the square meter. By leveraging these GIS tools, Dutch farmers have reported: A 25% reduction in synthetic nitrogen fertilizer usage Lower input costs Improved environmental compliance with EU regulations Maintained or increased crop yields These benefits contribute not only to economic sustainability but also to environmental conservation, helping reduce nitrogen runoff into waterways and lowering greenhouse gas emissions. 2. AI-Powered Crop Disease Prediction In 2025, the fusion of Geographic Information Systems (GIS) with Artificial Intelligence (AI) and satellite imagery has revolutionized how farmers identify and prevent crop diseases. These systems use deep learning algorithms trained on thousands of geotagged images and environmental datasets to detect early signs of plant stress, such as discoloration, unusual growth patterns, or pest hotspots, long before they become visible to the naked eye. By analyzing spatial data trends—like humidity levels, temperature fluctuations, and historical outbreak maps—GIS-enabled AI models can forecast the likelihood of disease outbreaks across specific farm zones. Farmers receive location-specific alerts and visual heatmaps, allowing them to take targeted preventive measures like spraying fungicides or isolating affected areas. Real-World Example: Cotton Farmers in India In Maharashtra, India, cotton farmers traditionally struggled with bollworm infestations, which could devastate crops overnight. In 2025, a state-led initiative equipped farmers with access to a GIS-AI tool that analyzed satellite imagery, pest behavior data, and real-time weather conditions. The tool predicted bollworm risk zones up to 7 days in advance, giving farmers a critical window to act. As a result: Farmers applied pesticides only in high-risk areas Chemical usage dropped by over 30% Crop loss was reduced by 40% Yields increased, and farmers saved on costs This smart disease management not only improved farm income but also helped minimize environmental damage from over-spraying. 3. Automated Drone Surveillance and Mapping In 2025, automated drones equipped with multispectral and thermal sensors, combined with powerful GIS software, have become a game-changing tool in modern agriculture. These drones fly pre-programmed routes over farmlands and collect high-resolution imagery that is processed in real-time to generate vegetation index maps, such as NDVI (Normalized Difference Vegetation Index). These maps help track plant vigor, chlorophyll levels, water stress, and signs of pest or disease activity. Using GIS analytics, farmers can visualize spatial differences in crop health, compare areas over time, and spot problems early—often before visible symptoms occur. The system also allows for 3D mapping of terrain and plant canopy, enabling more precise irrigation, fertilization, and harvesting strategies. Real-World Example: Smart Vineyards in California California’s wine-growing regions, such as Napa Valley, are at the forefront of drone-based GIS farming. In response to increasing droughts and strict water regulations, vineyard managers have deployed drone fleets integrated with GIS dashboards to monitor vine stress and optimize irrigation. Here’s how it works: Multispectral drones fly over vineyards and gather data on vine canopy health, temperature, and moisture levels. This data is uploaded into a GIS platform, which produces color-coded maps showing zones that are under- or over-watered. Managers use this information to adjust drip irrigation systems precisely, delivering water only where it’s needed. Results: 30% water savings during California’s peak dry seasons Enhanced grape quality and uniformity Reduced energy costs for pumping water Better compliance with state water conservation laws This precision approach has allowed growers to maintain premium yields while adapting to a changing climate. Related Content: 5 Best Remote Sensing Projects for Crop Monitoring and Yield Prediction Top 10 GIS Research Topics for Sustainable Agriculture 7 Powerful GIS Applications in Agriculture 4. Smart Irrigation Planning In 2025, water management in agriculture has become far more intelligent, thanks to Smart Irrigation Planning powered by GIS. This innovation combines weather forecasting, soil moisture mapping, topography, and crop-specific water needs to create automated, location-specific irrigation schedules. By integrating GIS data layers—such as soil type, slope, evapotranspiration rates, and rainfall patterns—with IoT-connected sensors, farmers can now design field-level irrigation strategies that adjust in real time. These systems eliminate guesswork and manual intervention, ensuring just the right amount of water is delivered at the right time and place, improving both crop health and resource efficiency. Real-World Example: Israel’s Water-Smart Farms Israel, a global leader in agricultural water efficiency, has fully embraced GIS-driven irrigation. Many Israeli farmers, particularly those cultivating high-value crops like dates, avocados, and citrus, use systems that combine GIS, weather stations, and IoT soil moisture sensors. Here’s how it works: Soil moisture sensors feed live data into a GIS platform. The system cross-references this data with weather forecasts, … Read more

7 Powerful GIS Applications in Agriculture

GIS applications in agriculture

In the modern era of precision agriculture, Geographic Information Systems (GIS) have become a game-changer. By integrating location-based data with farming practices, GIS empowers farmers, agronomists, and agricultural policymakers to make smarter, data-driven decisions. In this blog post, we’ll explore 7 powerful GIS applications in agriculture that are revolutionizing how food is grown, managed, and delivered—all with improved efficiency and sustainability. 7 Powerful GIS Applications in Agriculture 1. Precision Farming and Site-Specific Management Precision farming, also known as site-specific crop management (SSCM), is a cutting-edge agricultural technique that uses Geographic Information Systems (GIS) to observe, measure, and respond to field variability in real-time. It enables farmers to make smarter decisions tailored to specific parts of their land, rather than managing entire fields uniformly. What is Site-Specific Management? Site-Specific Management is the practice of customizing farming inputs (like seeds, fertilizers, pesticides, and irrigation) based on spatial data collected about different parts of a field. This is where GIS comes into play—it helps identify variations within a field and provides location-specific insights. How GIS Powers Precision Farming: Data Collection and MappingGIS integrates data from multiple sources like satellite imagery, drones, soil sensors, and yield monitors. These datasets are layered and analyzed to understand field conditions including: Soil fertility and moisture Crop health Topography and drainage Pest and disease outbreaks Variable Rate Technology (VRT)With GIS maps, farmers can use VRT equipment to apply inputs variably across the field. For example: Apply more fertilizer to nutrient-deficient zones Reduce water use in naturally moist areas Target pest control only where needed Increased EfficiencyBy applying inputs precisely where they’re needed, farmers reduce waste, lower input costs, and enhance productivity. This reduces environmental impact and supports sustainable farming. Real-Time MonitoringGIS allows farmers to monitor field performance throughout the season. They can adjust strategies based on weather patterns, crop growth, and pest dynamics. Historical Data AnalysisGIS stores historical records of yield and crop health across seasons. Analyzing this data helps identify patterns and long-term trends that influence decision-making for future seasons. Benefits of Using GIS in Precision Farming: Improved crop yields and quality Optimized use of seeds, fertilizers, and water Reduced environmental footprint Early detection of diseases and pests Cost-effective and sustainable operations Example in Practice: A rice farmer using GIS in Nepal might divide a 10-hectare field into zones based on soil moisture. Instead of flooding the entire field uniformly, irrigation is applied only to the drier zones. Over time, this technique can save thousands of liters of water while increasing rice productivity. 2. Soil Mapping and Analysis Understanding the soil beneath our feet is the cornerstone of successful agriculture. Soil properties—such as texture, fertility, moisture, and pH—have a direct impact on plant health, crop yield, and input efficiency. GIS (Geographic Information Systems) has transformed traditional soil study into a spatially rich and highly actionable process known as soil mapping and analysis. What is Soil Mapping? Soil mapping is the process of identifying, classifying, and spatially representing different soil types and their properties across a landscape. With the help of GIS, farmers and agronomists can create high-resolution, interactive maps that visualize these properties at field, farm, or regional scales. How GIS Supports Soil Mapping and Analysis: Soil Type ClassificationGIS helps in the creation of detailed maps that show the distribution of soil types like: Clay (retains water, ideal for rice) Loam (fertile, well-drained, suitable for most crops) Sandy (drains quickly, needs frequent watering) Spatial Analysis of Soil PropertiesUsing data from sensors, soil samples, and remote sensing, GIS analyzes: pH levels: Indicates soil acidity or alkalinity, crucial for crop suitability Organic matter: Supports microbial life and improves fertility Moisture content: Affects irrigation planning and drought resistance Cation exchange capacity (CEC): Determines nutrient retention ability Detection of Nutrient DeficienciesGIS maps highlight zones with deficiencies in nitrogen, phosphorus, potassium, and trace elements. This enables farmers to apply targeted fertilizer treatments, rather than wasting resources uniformly. Temporal MonitoringOver time, GIS can show how soil quality is changing due to overuse, erosion, or improved practices. This is useful for land restoration and conservation planning. 3D Soil ModelingWith digital elevation models (DEMs), GIS can create 3D models of soil layers, helping understand soil depth, drainage patterns, and erosion risks. Benefits for Farmers and Planners: Crop Suitability Planning: Select the most appropriate crops based on soil compatibility. Efficient Fertilizer Use: Apply nutrients only where needed, reducing costs and runoff. Better Irrigation Scheduling: Understand moisture retention to reduce water waste. Soil Conservation: Identify erosion-prone zones and implement sustainable practices. Real-World Example: A wheat farmer in India uses GIS to map soil pH and organic content across a 50-acre farm. The analysis shows that the eastern plots are slightly acidic and low in nitrogen. Based on this insight, the farmer applies lime and nitrogen-rich fertilizers only to that area, improving yield by 15% and reducing input cost by 20%. Related Content:  7 Powerful GIS Applications in Climate Science 10 Best QGIS Plugins for Digitizing 12 Best Business Ideas for Land Surveyors in 2025 GIS Software Development: A Complete Roadmap for 2025 3. Weather Monitoring and Forecasting Weather is one of the most critical factors in agriculture. A single untimely rainfall or a sudden frost can damage entire crops and disrupt food production. That’s why weather monitoring and forecasting, powered by GIS (Geographic Information Systems), has become an essential tool for modern-day farmers. By integrating real-time and historical weather data with spatial farm maps, GIS helps farmers make informed, timely decisions that protect their crops and maximize productivity—even in the face of climate uncertainty. How GIS Enhances Weather Monitoring: Real-Time Data IntegrationGIS can ingest live data from: Weather satellites Ground-based meteorological stations IoT weather sensors on the farm This data is spatially visualized across farm areas to monitor: Rainfall distribution Temperature fluctuations Humidity levels Wind direction and speed Forecasting and Early Warning SystemsGIS platforms can overlay weather models with farm maps to forecast: Rainfall or drought probabilities Storm or hail threats Frost risk during critical growth stages Heatwaves or cold spells These forecasts help in proactive … Read more