
Ideal for university students looking for impactful research areas
Geographic Information Systems (GIS) have revolutionized modern agriculture by enabling precise mapping, spatial analysis, and informed decision-making. For agricultural students, incorporating GIS into their dissertation not only boosts academic value but also opens up career opportunities in agri-tech, sustainability, and land management sectors.
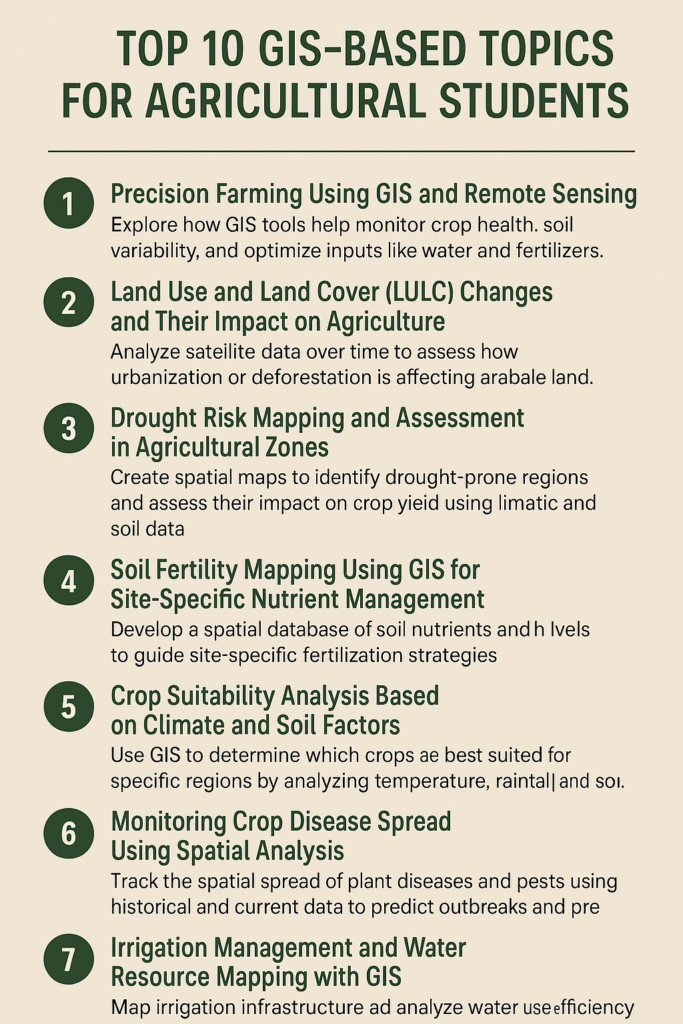
In this post, we’ll explore the top 10 GIS-based dissertation topics that are highly relevant, researchable, and impactful in the agricultural domain.
10 GIS-Based Dissertation Topics for Agricultural Students
1. Precision Farming Using GIS and Remote Sensing
Precision farming, also known as precision agriculture, is a cutting-edge approach that leverages GIS (Geographic Information Systems) and remote sensing technologies to manage farming practices with pinpoint accuracy. This method enables farmers and researchers to collect, analyze, and act on vast amounts of spatial and temporal data related to crop health, soil conditions, and environmental variables.
What Makes It a Great Dissertation Topic?
GIS tools provide farmers with real-time mapping and spatial analysis, allowing them to:
-
Identify variations in soil fertility across a field
-
Monitor plant growth and crop health using NDVI (Normalized Difference Vegetation Index)
-
Optimize the use of inputs such as fertilizers, pesticides, and water
-
Increase overall crop yield while minimizing waste and environmental impact
Remote sensing data—from satellites, drones, or UAVs—complements GIS by offering frequent and large-scale views of farm conditions. Together, they form the technological foundation of smart farming.
Research Scope for Students
A student pursuing this topic can explore:
-
The integration of UAV/drone data with GIS for real-time decision-making
-
Development of precision maps for site-specific nutrient management
-
Case studies on yield prediction models using temporal satellite imagery
-
Cost-benefit analysis of implementing GIS-based precision farming in small vs. large farms
Real-World Applications
-
Variable rate application (VRA) of fertilizers
-
Irrigation scheduling based on soil moisture mapping
-
Pest/disease forecasting using spatial disease spread models
-
Zonal management based on micro-climatic conditions
Tools & Technologies You Can Use
-
QGIS / ArcGIS for spatial data processing and map generation
-
Sentinel-2 or Landsat imagery for vegetation indices
-
DroneDeploy or Pix4D for high-resolution aerial data
-
OpenCV, Google Earth Engine for automated image analysis
2. Land Use and Land Cover (LULC) Changes and Their Impact on Agriculture
Land Use and Land Cover (LULC) studies are essential for understanding how human activities and natural processes are transforming the earth’s surface. For agriculture, such changes directly influence the availability of arable land, soil quality, water resources, and ecosystem services. Using GIS and remote sensing, students can effectively assess these changes and analyze their long-term impacts on agricultural sustainability.
Why Is This a Strong Dissertation Topic?
With rapid urban expansion, deforestation, industrialization, and infrastructure development, agricultural lands are shrinking in many parts of the world. GIS and remote sensing tools allow for:
-
Temporal analysis of land use transformation (e.g., farmland to urban or barren land)
-
Quantification of agricultural land loss
-
Identification of regions at risk for food insecurity
-
Support for land-use planning and policy-making
Potential Research Questions
Students exploring this topic can focus on:
-
How has urban sprawl impacted agricultural land in a specific region over the last 20 years?
-
What is the relationship between LULC change and crop productivity in vulnerable zones?
-
How do LULC transitions correlate with climate variables and water availability?
-
Can GIS-based LULC change detection support better land management practices?
Tools and Data Sources
-
Landsat, MODIS, Sentinel satellite imagery for time-series analysis
-
Supervised and unsupervised classification using tools like QGIS, ArcGIS, or Google Earth Engine
-
Change detection algorithms such as NDVI difference, post-classification comparison, and image differencing
-
Ground-truth data and field surveys for validation
Real-World Applications
-
Agricultural zoning and land-use regulation
-
Supporting food security policies at local and national levels
-
Predictive modeling of future land use changes
-
Conservation planning for preserving fertile lands and natural habitats
Case Study Ideas
-
LULC changes in river basins and their effects on irrigation agriculture
-
Urban expansion around peri-urban agricultural zones
-
Shifting cultivation and deforestation in tropical regions
3. Drought Risk Mapping and Assessment in Agricultural Zones
Drought is one of the most devastating natural hazards affecting agriculture. With climate change increasing the frequency and severity of droughts, understanding where and how they occur is critical for ensuring food security, sustainable farming, and risk mitigation.
Through GIS modeling and remote sensing, students can develop spatial drought risk maps that highlight vulnerable agricultural zones and quantify their potential impacts on crop productivity.
Why Is This a Valuable Dissertation Topic?
Drought doesn’t just mean a lack of rain—it includes complex interactions between temperature rise, soil moisture loss, groundwater depletion, and evapotranspiration. By integrating these variables in a GIS environment, students can:
-
Identify high-risk areas for agricultural drought
-
Understand historical drought patterns using long-term data
-
Recommend drought-resilient planning and mitigation strategies
Potential Research Objectives
Your research can focus on:
-
Mapping agricultural drought-prone regions using Standardized Precipitation Index (SPI) or Vegetation Condition Index (VCI)
-
Assessing soil moisture variability and crop stress across seasons
-
Evaluating how climatic variables (rainfall, temperature) and land characteristics influence drought severity
-
Developing a Drought Vulnerability Index (DVI) for specific crop zones
Data and Tools You Can Use
-
MODIS, Sentinel-2, and Landsat for vegetation health monitoring (NDVI, EVI)
-
Climatic data from sources like CHIRPS, WorldClim, and IMD (rainfall, temperature)
-
Soil and land-use data from national agriculture departments or FAO
-
Tools like ArcGIS, QGIS, and Google Earth Engine for spatial analysis and modeling
Practical Applications
-
Informing irrigation planning and water resource allocation
-
Supporting early warning systems and agricultural drought advisories
-
Identifying zones for climate-resilient crop varieties
-
Assisting governments in policy-making and resource prioritization
Case Study Ideas
-
Drought impact mapping in rainfed agricultural areas
-
Comparison of drought trends before and after major climate events (e.g., El Niño)
-
Spatial-temporal drought risk assessment in semi-arid or arid zones
4. Soil Fertility Mapping Using GIS for Site-Specific Nutrient Management
Soil fertility plays a vital role in determining crop health, yield potential, and sustainable land use. By leveraging GIS tools to map the spatial variability of soil nutrients, pH levels, and organic matter, students can contribute to the development of site-specific nutrient management (SSNM) strategies—reducing input costs and enhancing soil health over time.
Why This Makes an Excellent Dissertation Topic
Traditional uniform fertilizer application often leads to overuse in some areas and underuse in others, resulting in nutrient imbalances, low efficiency, and environmental pollution. With GIS-based soil fertility mapping, it’s possible to:
-
Identify nutrient-deficient zones
-
Recommend balanced fertilization plans for specific plots
-
Optimize fertilizer and lime use based on real soil needs
-
Improve crop productivity sustainably
Potential Research Focus Areas
-
Creating spatial distribution maps of key soil nutrients (Nitrogen, Phosphorus, Potassium)
-
Interpolating soil pH, EC (Electrical Conductivity), and organic carbon levels
-
Analyzing how soil properties vary within different agro-climatic zones
-
Designing fertility zonation maps for targeted fertilizer recommendations
Data Collection & Tools
-
Soil samples from various grid points in a study area
-
Laboratory analysis for macro and micronutrients, pH, and organic matter
-
GIS tools like QGIS or ArcGIS for spatial interpolation using methods such as:
-
Integration with crop growth models or farm management systems
Practical Applications
-
Helps farmers apply fertilizers more efficiently (right amount, right place)
-
Reduces input cost and environmental degradation
-
Enhances long-term soil productivity and sustainability
-
Supports precision agriculture and nutrient management planning
Case Study Possibilities
-
Fertility mapping in high-intensity cropping areas (e.g., wheat-rice belts)
-
Pre- and post-harvest soil fertility evaluation in organic vs. conventional farms
-
Nutrient deficiency mapping in drought-prone or flood-prone zones
Related Content:
Top 10 GIS Research Topics for Sustainable Agriculture
10 Innovative Ways Farmers Are Using GIS in 2025
5 Best Remote Sensing Projects for Crop Monitoring and Yield Prediction
7 Powerful GIS Applications in Agriculture
5. Crop Suitability Analysis Based on Climate and Soil Factors
As global agricultural systems face increasing stress from climate change, land degradation, and resource constraints, identifying which crops are best suited to grow in particular regions has become more crucial than ever. Crop suitability analysis using GIS allows researchers to evaluate the interaction of various factors such as temperature, rainfall, soil type, and elevation to guide climate-smart agricultural planning.
Why This Topic Is Important
Farmers often select crops based on tradition or limited knowledge of their land’s characteristics, which may lead to poor yields, soil depletion, and economic loss. By conducting GIS-based suitability analysis, students can:
-
Recommend optimal crops for specific agroecological zones
-
Minimize crop failure risks due to climate incompatibility
-
Support resource-efficient and sustainable land use
-
Help design cropping patterns that match local conditions
Potential Research Questions
-
Which crops are best suited to a semi-arid region based on climatic and soil variables?
-
How do climate trends impact future crop suitability in a selected district?
-
Can crop suitability maps help design region-specific farming systems for food security?
-
What are the effects of soil pH and texture on crop zoning in your study area?
Data and Tools Required
-
Climatic data: Annual rainfall, temperature ranges, humidity (sources: WorldClim, IMD, NASA POWER)
-
Soil data: Texture, pH, drainage, organic matter (sources: FAO, national soil surveys)
-
Topographic data: Slope, elevation (from DEMs)
-
Tools: QGIS, ArcGIS, or Google Earth Engine for spatial modeling and map generation
GIS Techniques You Can Use
-
Multi-criteria decision analysis (MCDA) for crop suitability modeling
-
Weighted overlay analysis
-
Agro-ecological zone mapping
-
Buffer and reclassification tools for proximity analysis (e.g., water sources)
Real-World Applications
-
Helps farmers diversify crops to maximize yields and profits
-
Supports government crop insurance schemes and subsidies by region
-
Guides climate-resilient agriculture and adaptation planning
-
Assists NGOs and agri-startups in targeted farming advice
Case Study Ideas
-
Crop suitability mapping for pulses in drought-prone regions
-
Climate-smart rice or wheat zoning in floodplain areas
-
Suitability analysis for introducing high-value crops like quinoa or millets in degraded lands
6. Monitoring Crop Disease Spread Using Spatial Analysis
The spread of plant diseases and pests can devastate crops and lead to significant economic losses. Early detection and effective management of these threats are essential for minimizing crop damage. GIS-based spatial analysis enables the tracking of disease and pest outbreaks by analyzing historical and current data, helping to predict future occurrences and implement timely interventions.
Why This Topic Is Important
Plant diseases and pests are major threats to global food security, with climate change and changing agricultural practices exacerbating the problem. By using GIS to monitor disease spread, students can:
-
Track the geographic spread of pests and diseases in real-time
-
Identify high-risk areas and predict future outbreaks
-
Develop targeted strategies for pest control and disease management
-
Minimize crop losses and improve food security
Potential Research Questions
-
How can GIS be used to predict the spread of a specific crop disease in a given region?
-
What spatial factors (e.g., temperature, humidity, proximity to water sources) influence pest and disease outbreaks?
-
How can historical pest infestation data be used to forecast future crop disease patterns?
-
Can GIS help optimize pesticide application by identifying disease hotspots?
Data and Tools Required
-
Pest and disease data: Historical and real-time records of pest and disease occurrences (sources: FAO, local agricultural departments)
-
Climatic data: Temperature, humidity, rainfall, and wind patterns (sources: WorldClim, IMD, NASA POWER)
-
Topographic data: Elevation, slope, and land use (from DEMs and satellite imagery)
-
Remote sensing data: Satellite imagery for identifying vegetation health and pest spread (sources: Landsat, MODIS)
Tools: QGIS, ArcGIS, or Google Earth Engine for spatial analysis and mapping
GIS Techniques You Can Use
-
Spatial epidemiology models to track the spread of diseases and pests
-
Hotspot analysis to identify areas with a higher likelihood of disease outbreaks
-
Buffer analysis to study proximity factors (e.g., proximity to water sources, farms, or roads)
-
Time-series analysis to detect trends and forecast future disease spread
Real-World Applications
-
Helps farmers implement early-warning systems for pest and disease outbreaks
-
Assists agricultural authorities in developing region-specific pest control strategies
-
Aids in determining optimal spraying zones and reducing pesticide use
-
Supports the creation of integrated pest management systems
Case Study Ideas
-
Mapping the spread of wheat rust in a particular region
-
Using GIS to track and predict the movement of the fall armyworm in Africa
-
Analyzing the spread of bacterial blight in rice crops and identifying high-risk zones
7. Irrigation Management and Water Resource Mapping with GIS
Efficient water management is critical for ensuring sustainable agricultural practices, especially in regions where water scarcity is a growing concern. GIS-based mapping and analysis of irrigation infrastructure and water use can help improve irrigation practices, optimize water resources, and enhance crop productivity.
Why This Topic Is Important
Agriculture is one of the largest consumers of water globally, and inefficient irrigation practices can lead to water wastage, crop failure, and environmental degradation. By using GIS to map irrigation systems and analyze water use efficiency, students can:
-
Optimize water distribution and reduce wastage in agricultural areas
-
Improve crop yields by ensuring appropriate water supply for each crop
-
Support sustainable water use in water-scarce regions
-
Provide data-driven insights for policy-making and water resource management
Potential Research Questions
-
How can GIS be used to map and monitor irrigation infrastructure in a specific region?
-
What are the spatial patterns of water use efficiency across different farming areas?
-
How can GIS help in identifying areas with water scarcity and optimizing irrigation practices accordingly?
-
Can spatial water balance models improve water management in large-scale agricultural operations?
Data and Tools Required
-
Water use data: Historical and real-time data on water consumption, irrigation schedules, and crop water requirements (sources: local water authorities, farm data)
-
Irrigation infrastructure data: Location, type, and condition of irrigation systems (e.g., canals, pipelines, pumps)
-
Topographic data: Elevation, slope, and land use to analyze water flow and drainage (from DEMs)
-
Climatic data: Rainfall, temperature, and evapotranspiration data (sources: WorldClim, IMD, NASA POWER)
-
Satellite imagery: For monitoring crop health, water stress, and irrigation coverage (sources: Landsat, MODIS)
Tools: QGIS, ArcGIS, or Google Earth Engine for spatial analysis, water balance modeling, and map creation
GIS Techniques You Can Use
-
Water balance modeling to assess the supply and demand of water resources in agricultural areas
-
Hydrological modeling to predict water flow and availability in irrigation systems
-
Buffer and proximity analysis to optimize irrigation zones based on distance to water sources
-
Change detection using satellite imagery to monitor changes in irrigation infrastructure or water use over time
Real-World Applications
-
Helps farmers optimize irrigation schedules and improve water use efficiency
-
Assists governments in designing sustainable water management policies and infrastructure development
-
Supports the creation of water-efficient irrigation systems, such as drip or sprinkler irrigation
-
Aids in monitoring and mitigating the impact of irrigation on groundwater levels
Case Study Ideas
-
Mapping and optimizing irrigation networks in water-scarce regions, such as parts of California or the Middle East
-
Evaluating the impact of water-saving technologies like drip irrigation in large-scale farms
-
Using GIS to assess water use efficiency in irrigation systems across different agro-ecological zones
8. Impact of Climate Change on Agricultural Productivity: A GIS-Based Study
As climate change accelerates, its effects on agriculture—such as altered crop patterns, changing rainfall, and temperature shifts—are becoming more pronounced. Using GIS to analyze spatial-temporal data can provide valuable insights into how climate variables influence agricultural productivity, helping to adapt farming practices to mitigate these effects.
Why This Topic Is Important
Climate change poses significant challenges to agricultural systems, including unpredictable weather patterns, droughts, and floods, which can lead to reduced crop yields and food insecurity. By using GIS to study the relationship between climate variables and agricultural productivity, students can:
-
Assess the impact of climate change on crop yields and production systems
-
Identify regions most vulnerable to climate change and develop adaptive strategies
-
Enhance crop resilience to extreme weather conditions
-
Support informed decision-making for sustainable agricultural planning
Potential Research Questions
-
How does increasing temperature affect the productivity of staple crops like wheat and rice in a given region?
-
What are the long-term trends in precipitation patterns and their effects on crop yield variability?
-
Can GIS-based analysis help predict the effects of climate change on future crop production?
-
How do changing climatic conditions affect the spatial distribution of crop types across different agro-ecological zones?
Data and Tools Required
-
Climate data: Historical and projected temperature, rainfall, humidity, and other climate variables (sources: WorldClim, IPCC, NASA POWER)
-
Crop yield data: Historical yield records, crop production statistics (sources: FAO, local agricultural departments)
-
Soil data: Soil type, texture, fertility, and pH for understanding crop growth conditions
-
Remote sensing data: Satellite imagery to monitor vegetation health, crop types, and land use change (sources: Landsat, MODIS)
-
Topographic data: Elevation, slope, and land use data (from DEMs)
Tools: QGIS, ArcGIS, or Google Earth Engine for spatial-temporal analysis, climate modeling, and map generation
GIS Techniques You Can Use
-
Spatial-temporal modeling to analyze changes in crop yield over time relative to shifting climate variables
-
Trend analysis to detect long-term climate patterns and their effect on agriculture
-
Climate projection modeling to simulate future climate scenarios and their potential impact on crop productivity
-
Suitability modeling to assess the best crop varieties for future climate conditions
Real-World Applications
-
Helps farmers adjust planting times, crop varieties, and irrigation practices based on predicted climate changes
-
Supports governments and NGOs in developing climate-resilient agricultural policies
-
Assists in creating early warning systems for extreme weather events affecting agriculture
-
Aids in identifying high-risk agricultural areas to prioritize adaptation measures
Case Study Ideas
-
Analyzing the impact of rising temperatures on maize production in sub-Saharan Africa
-
Studying the effects of shifting rainfall patterns on rice yields in Southeast Asia
-
Using GIS to predict the vulnerability of wheat-growing regions in Europe to climate change
-
Mapping climate-induced changes in crop patterns across the United States Midwest
9. Assessment of Organic Farming Potential Using GIS Tools
As demand for organic produce continues to grow, identifying areas best suited for organic farming has become essential for promoting sustainable agricultural practices. GIS tools can help assess soil quality, water availability, and environmental conditions, enabling informed decisions about where organic farming can thrive.
Why This Topic Is Important
Organic farming is increasingly seen as a sustainable alternative to conventional farming, offering numerous environmental benefits such as reduced pesticide use and improved soil health. However, not all regions are equally suited to organic practices. GIS-based assessment helps to:
-
Identify regions with the most favorable conditions for organic farming
-
Ensure optimal use of natural resources while maintaining environmental balance
-
Promote soil health and biodiversity through informed land management
-
Support the transition from conventional to organic farming in areas with suitable conditions
Potential Research Questions
-
How can GIS be used to identify areas with the most suitable soil conditions for organic farming?
-
What environmental factors (e.g., rainfall, temperature, topography) contribute to the success of organic agriculture in a given region?
-
How can GIS help assess water availability and its impact on the feasibility of organic farming?
-
What is the potential for organic farming to replace conventional farming in specific agro-ecological zones?
Data and Tools Required
-
Soil data: Soil texture, fertility, pH, organic matter content (sources: FAO, national soil surveys)
-
Climatic data: Temperature, rainfall, humidity, and growing season length (sources: WorldClim, IMD, NASA POWER)
-
Water availability data: Groundwater levels, surface water availability (sources: local water authorities, remote sensing)
-
Land use data: Existing agricultural practices, crop types, and environmental protection zones (from satellite imagery)
-
Topographic data: Elevation, slope, and landform features (from DEMs)
Tools: QGIS, ArcGIS, or Google Earth Engine for spatial analysis and mapping
GIS Techniques You Can Use
-
Spatial analysis to identify areas with ideal soil, water, and climatic conditions for organic farming
-
Multi-criteria decision analysis (MCDA) to evaluate multiple factors (e.g., soil quality, water resources, and climate) and rank areas based on suitability for organic agriculture
-
Suitability modeling to define and map zones suitable for organic farming based on land and environmental criteria
-
Buffer analysis to assess proximity to environmentally protected areas, markets, and transportation routes
Real-World Applications
-
Helps farmers identify the most appropriate areas for transitioning to organic farming
-
Supports policy decisions for allocating resources to promote sustainable agriculture
-
Assists organic certification bodies in evaluating land suitability for organic certification
-
Guides NGOs and agricultural extension services in recommending best practices for organic farming
Case Study Ideas
-
Mapping organic farming potential in semi-arid regions with limited water availability
-
Assessing soil and water quality for organic farming in the Indian Punjab region
-
Identifying potential organic farming zones in Latin America for high-value crops like coffee or cacao
-
Using GIS to find suitable areas for organic vegetable farming in urban and peri-urban spaces
10. Mapping Agricultural Biodiversity Using GIS
Agricultural biodiversity, encompassing a wide variety of crops, livestock, and their genetic resources, is essential for food security, ecosystem health, and climate resilience.
GIS-based mapping tools allow researchers and farmers to assess the distribution and diversity of agricultural species, understand how land use influences biodiversity, and identify hotspots of agricultural biodiversity that need protection.
Why This Topic Is Important
Agricultural biodiversity plays a crucial role in enhancing resilience to pests, diseases, and climate change. However, intensifying monoculture farming, deforestation, and land degradation threaten this biodiversity. GIS-based mapping helps to:
-
Identify regions with rich agricultural biodiversity
-
Assess the impact of land use practices on biodiversity conservation
-
Support sustainable farming systems that preserve and enhance agro-biodiversity
-
Guide policymakers in protecting biodiversity hotspots and promoting agro-ecological farming practices
Potential Research Questions
-
How can GIS be used to map the spatial distribution of different crop and livestock species across regions?
-
What are the effects of changing land use patterns (e.g., urbanization, monoculture farming) on agricultural biodiversity?
-
How can GIS help identify agricultural biodiversity hotspots in rural areas?
-
What is the relationship between agro-biodiversity and ecosystem services, such as pollination and soil fertility?
Data and Tools Required
-
Crop and livestock data: Distribution, variety, and yield information (sources: FAO, national agricultural surveys)
-
Land use/land cover data: Land use changes, crop types, and farming practices (sources: remote sensing, national surveys)
-
Soil and environmental data: Soil quality, fertility, moisture levels, and ecological conditions that support biodiversity (sources: FAO, soil surveys)
-
Biodiversity records: Data on wild plant species, pollinators, and other organisms that contribute to agricultural systems (sources: biodiversity organizations, conservation agencies)
-
Topographic data: Elevation, slope, and landscape features influencing biodiversity (from DEMs)
Tools: QGIS, ArcGIS, or Google Earth Engine for spatial analysis and biodiversity mapping
GIS Techniques You Can Use
-
Biodiversity mapping to assess and visualize the distribution of crops, livestock, and other agricultural species across landscapes
-
Hotspot analysis to identify areas with high agricultural biodiversity and critical ecosystems
-
Change detection using satellite imagery to monitor land use changes and their impacts on biodiversity
-
Buffer analysis to assess proximity to protected areas, natural reserves, and biodiversity corridors
-
Multi-criteria decision analysis (MCDA) to prioritize areas for biodiversity conservation based on multiple factors (e.g., habitat quality, species richness, and human impact)
Real-World Applications
-
Helps farmers diversify crops and livestock to promote biodiversity and increase resilience to pests and diseases
-
Supports national and international biodiversity conservation efforts by identifying key agro-biodiversity areas
-
Assists governments and NGOs in developing strategies for preserving traditional farming practices and native species
-
Guides sustainable land management policies that consider both agricultural productivity and biodiversity conservation
Case Study Ideas
-
Mapping biodiversity of rice varieties and traditional farming systems in South Asia
-
Assessing the impacts of land-use change on agro-biodiversity in sub-Saharan Africa
-
Using GIS to monitor biodiversity loss in regions where commercial agriculture has replaced traditional farming
-
Identifying hotspots of crop diversity for conservation in regions like the Andes, where numerous potato varieties are grown
Final Thoughts
GIS technology provides agricultural students with robust tools to address real-world problems through spatial thinking. Whether you’re interested in precision agriculture, sustainability, or climate change, these dissertation topics can help you craft a research project that is both impactful and relevant.
If you’re a university student looking to make a meaningful contribution to the future of agriculture, consider one of these GIS-based dissertation topics—and take the first step toward becoming a data-driven agricultural innovator.
Frequently Asked Questions (FAQs)
1. Why should agricultural students consider GIS-based dissertation topics?
GIS helps analyze spatial data related to land, soil, crops, and climate, enabling better agricultural planning and research. It also improves job prospects in agri-tech, environmental analysis, and precision farming.
2. What are the tools commonly used for GIS-based agricultural research?
Popular tools include QGIS (open-source), ArcGIS, Google Earth Engine, ENVI, and ERDAS Imagine. These tools allow for spatial mapping, remote sensing, and data visualization.
3. Can GIS be used for small-scale farming research?
Yes, GIS can be scaled to small farms. It can help analyze soil fertility, water use, and crop performance even at the local level, making it ideal for precision farming research.
4. Do I need programming knowledge to do GIS-based research?
Basic programming knowledge in Python or R can be helpful but is not mandatory. Most GIS platforms have user-friendly interfaces for beginners.
5. Where can I find open-source data for my GIS dissertation?
You can access spatial data from sources like:
-
USGS Earth Explorer
-
Sentinel Hub
-
FAO GeoNetwork
-
OpenStreetMap
-
NASA Earthdata
6. How can GIS help address climate change in agriculture?
GIS allows researchers to analyze climate trends, map vulnerable zones, and develop adaptive strategies for crop planning and sustainable farming.