ArcMap Review: A Comprehensive Overview of a GIS Classic

ArcMap

ArcMap, the desktop component of Esri’s ArcGIS suite, has been a cornerstone of geographic information systems (GIS) for years. Widely praised for its powerful data analysis, mapping, and spatial analysis capabilities, ArcMap has been the go-to tool for professionals across various industries, from environmental science to urban planning. While newer software like ArcGIS Pro is gaining traction, ArcMap continues to hold significant value for those who require robust GIS tools and a user-friendly interface. In this review, we’ll dive into its features, strengths, limitations, and best use cases, helping you understand whether ArcMap still fits your GIS needs in the modern world of geospatial technology. ArcMap Review ArcMap, a core application within the ArcGIS suite by Esri, has long been a leading choice for geospatial professionals. Known for its robust mapping, spatial analysis, and data management capabilities, ArcMap has been a staple in the GIS industry for years. Despite the emergence of newer software like ArcGIS Pro, ArcMap remains a powerful tool for professionals working with geographic data across various sectors such as urban planning, environmental research, and natural resource management.   GO TO ArcMAP Rating: 4.7/5 ArcMap Overview ArcMap is a desktop-based GIS application that enables users to create, view, analyze, and manage geographic data through maps. It offers a comprehensive set of tools for visualizing spatial information, conducting spatial analysis, and generating high-quality cartographic outputs. With its robust capabilities, ArcMap allows users to manipulate and process both vector and raster data, making it an essential tool for professionals working in various fields of geospatial analysis and mapping. Some of the key features and capabilities of ArcMap include: Mapping and Visualization ArcMap provides robust tools for creating detailed and customized maps. It supports both vector and raster data, allowing you to visualize geographic features with clarity and precision. Users can create high-quality cartographic outputs for print and digital media, customizing every aspect of map design. Spatial Analysis and Geoprocessing One of ArcMap’s standout features is its powerful spatial analysis capabilities. It offers an extensive suite of tools for performing complex spatial operations, such as overlay analysis, proximity analysis, buffering, and statistical modeling. These tools help users make informed decisions based on geographic data. Georeferencing ArcMap makes it easy to align maps or aerial imagery with a known coordinate system. The georeferencing tools allow users to map images with known geographic coordinates and integrate them into a GIS project for further analysis. Data Management and Editing ArcMap provides comprehensive tools for managing, editing, and processing geospatial data. Whether working with vector data (such as shapefiles) or raster data (such as satellite images), users can easily manipulate and update datasets to ensure their maps are accurate and up-to-date. Geodatabase Integration ArcMap is tightly integrated with Esri’s geodatabase model, allowing for efficient data management. It supports both personal and enterprise geodatabases, enabling multi-user environments for collaborative projects and complex data management tasks. ModelBuilder and Automation ArcMap includes ModelBuilder, a tool that lets users automate complex workflows by building custom models using a visual interface. This is particularly useful for performing repetitive tasks, creating batch processes, and automating spatial analysis. Customizable Symbology and Labeling ArcMap offers advanced symbology and labeling features that allow users to visually represent geographic data in a way that is both functional and aesthetically pleasing. Custom symbols, color ramps, and label styles help create maps that convey the desired information clearly and effectively. Support for Raster Data ArcMap excels at working with raster data, including satellite imagery, aerial photography, and digital elevation models (DEMs). The software provides tools for raster analysis, including classification, reclassification, and surface analysis, among others. Print Layouts and Map Production ArcMap has robust capabilities for map production, offering detailed print layouts with options for adding legends, north arrows, scale bars, and other map elements. This makes it ideal for producing professional-quality maps for reports, presentations, or fieldwork. Advanced Cartographic Design Users can fine-tune their map design with advanced cartographic tools in ArcMap, including options for map projections, coordinate systems, and layout elements. This ensures that the final map product meets high standards for both visual appeal and accuracy. Read Also: ERDAS Imagine – Revolutionizing Geospatial Imaging and Analysis ArcMap History 1999: ArcMap was first introduced as part of the ArcGIS software suite by Esri, aimed at providing a powerful desktop GIS platform. Early 2000s: Quickly became a widely used tool for mapping, spatial analysis, and geospatial data management across industries such as urban planning, environmental science, and government. 2003: ArcMap started to integrate advanced geoprocessing and spatial analysis tools, allowing users to perform complex operations on both raster and vector data. 2007: Introduced the ability to automate workflows using ModelBuilder, enhancing efficiency and usability for complex GIS tasks. 2010s: ArcMap’s tools evolved to support high-quality cartographic outputs, enabling professionals to create visually appealing and precise maps for print and digital use. 2015: Esri launched ArcGIS Pro, a new 64-bit, multi-threaded application with modern features, marking the beginning of a gradual shift towards the new platform. Late 2010s: Despite the release of ArcGIS Pro, ArcMap remained widely used, especially in legacy workflows and by organizations that were accustomed to its interface. 2020s: Esri continued to support ArcMap while encouraging users to transition to ArcGIS Pro, which offers more advanced capabilities, better performance, and enhanced integration with cloud-based tools. Strengths of ArcMap Comprehensive GIS Tools: ArcMap provides a wide range of tools for spatial analysis, data visualization, geospatial data management, and cartography, making it a versatile platform for GIS professionals. Advanced Spatial Analysis: It offers powerful geoprocessing tools for analyzing spatial data, from basic overlays to complex operations like buffering, interpolation, and surface analysis. High-Quality Cartography: ArcMap excels in creating high-quality, detailed maps with advanced symbology options, customizable map layouts, and printing capabilities, making it a go-to tool for producing professional cartographic outputs. Compatibility with Various Data Formats: ArcMap supports a wide variety of data formats, including both raster and vector data, and integrates seamlessly with Esri’s file formats like shapefiles, geodatabases, and raster datasets. Customizability: … Read more

ArcGIS Online Review: Empowering Cloud-Based GIS Mapping and Collaboration

ArcGIS Online

In today’s fast-paced world of geospatial technology, ArcGIS Online emerges as a powerful platform for mapping, sharing, and analyzing spatial data in the cloud. Developed by Esri, this web-based GIS software enables users to create dynamic maps, perform spatial analysis, and collaborate seamlessly—anytime, anywhere. Whether you’re a GIS professional, an urban planner, or a student, ArcGIS Online offers a robust set of tools to bring your projects to life. With its intuitive interface, cloud storage capabilities, and integration with other Esri products, ArcGIS Online is transforming how organizations visualize and share geographic information. In this review, we’ll explore its standout features, use cases, and why it’s a go-to choice for cloud-based GIS solutions. ArcGIS Online Software Review ArcGIS Online is Esri’s premier cloud-based GIS platform that enables users to create, analyze, and share geospatial data seamlessly. Designed for flexibility and collaboration, it empowers users to access their projects anytime, anywhere, with an internet connection. Its integration with other Esri products and vast capabilities make it a vital tool for GIS professionals, educators, and organizations aiming to leverage the power of spatial data in the digital age. GO TO ARCGIS ONLINE Rating 4.0/5 Why ArcGIS Online is Best? Here’s an two reason why ArcGIS Online is Best. 1. Use Size and Color to Map Your Variables When visualizing data, size and color are two powerful tools to communicate complex information effectively: Size: Use the size of symbols to represent the magnitude of a variable. For example, larger circles on a map might indicate higher population densities, while smaller circles indicate lower densities. Color: Use color gradients to represent variations in a variable. For instance, a heatmap could show temperature ranges, where red represents higher values and blue represents lower values. Combining size and color allows you to depict two variables simultaneously, enhancing the richness of your map’s story. For example, you could use circle size for population and color for income level, providing a multi-dimensional view of the data. Read Also: ArcGIS Pro Review: Transforming the Way We Map and Analyze 2. Explore Relationships Between Two Topics Within a Single Map Mapping two topics together can uncover hidden correlations or patterns. For instance: Overlaying unemployment rates with education levels could reveal areas where low education levels are linked to high unemployment. Visualizing crime rates alongside street lighting data could help identify whether better lighting correlates with reduced crime. Using tools like ArcGIS Online, you can layer datasets and perform spatial analysis to determine relationships. Techniques like correlation mapping, spatial joins, or clustering analysis help identify patterns and make informed decisions based on your findings. ArcGIS Online History ArcGIS Online, developed by Esri, has been a trailblazer in cloud-based Geographic Information System (GIS) technology. Its evolution reflects Esri’s commitment to providing accessible, collaborative, and powerful geospatial solutions for users worldwide. Here’s a look at its milestones: 1. Initial Launch (2012) ArcGIS Online debuted in 2012 as a revolutionary cloud-based platform. Its primary goal was to enable users to create and share maps online without the need for desktop GIS software. This marked the beginning of cloud GIS, opening doors to wider accessibility and collaboration. 2. Enhancements in Collaboration (2013-2015) 2013: Introduction of Organization Accounts, allowing businesses and teams to manage their data, maps, and workflows collectively. 2015: ArcGIS Online expanded its sharing capabilities with the ability to embed interactive maps and apps on websites, enhancing public engagement. 3. Integration with Other Esri Products (2016-2018) Integration with desktop tools like ArcGIS Pro made it seamless to publish maps and datasets from desktop environments to the cloud. The ArcGIS Living Atlas of the World was introduced, offering a rich collection of basemaps, imagery, and authoritative datasets for users to enhance their projects. 4. Advancements in Spatial Analysis and Machine Learning (2019-2021) Spatial Analysis Tools were integrated into ArcGIS Online, allowing users to perform advanced geoprocessing directly in the cloud. Machine learning capabilities, such as image classification and clustering, were added to provide deeper insights into geospatial data. 5. Modern Innovations (2022-Present) ArcGIS Online continues to evolve with features like real-time data integration, 3D web scenes, and improved performance for large datasets. Esri introduced enhanced support for industry-specific applications, including urban planning, disaster management, and environmental conservation. Read Also: Google Earth Pro – Explore and Discover the Planet Strengths of ArcGIS Online ArcGIS Online is a powerful cloud-based GIS platform that stands out for its versatility and user-friendly features. Here are its key strengths: 1. Easy Accessibility and Cloud Integration Operates directly in a web browser, eliminating the need for complex installations. Cloud-based architecture allows users to access maps, data, and tools from anywhere with an internet connection. 2. Seamless Collaboration Supports team-based workflows with Organization Accounts, enabling shared access to maps, layers, and datasets. Users can share interactive maps and apps with the public or specific groups, promoting collaboration and community engagement. 3. Extensive Data Availability Provides access to the ArcGIS Living Atlas of the World, a comprehensive collection of basemaps, real-time data, and authoritative datasets. Offers pre-configured layers for demographic, environmental, and urban data analysis. 4. Advanced Spatial Analysis Tools Includes tools for spatial analysis, such as heat mapping, buffer creation, and overlay analysis, directly in the cloud. Supports workflows for predictive modeling, clustering, and suitability analysis. 5. Real-Time Data Integration Enables users to integrate real-time data feeds for applications like traffic monitoring, weather updates, and IoT sensor data visualization. 6. Rich Customization Options Users can create custom web maps, dashboards, and applications using built-in templates or APIs like Esri’s JavaScript API. Allows for styling maps with symbology, pop-ups, and custom visualizations. 7. Support for 3D Visualization Offers 3D scene viewers to visualize terrain, buildings, and spatial relationships in a three-dimensional environment. Helps users explore urban planning, disaster management, and infrastructure projects more effectively. 8. Scalability for Various Users Suitable for individual users, small businesses, and large enterprises. Flexible licensing models ensure affordability and scalability as needs grow. 9. Mobile and Field Data Collection Integrates with mobile apps like Collector for ArcGIS and … Read more

ArcGIS Pro Review: Transforming the Way We Map and Analyze

ArcGIS Pro

In the world of GIS (Geographic Information Systems), ArcGIS Pro stands out as a revolutionary tool designed to enhance mapping, spatial analysis, and data visualization. Developed by Esri, this advanced desktop application has become the go-to solution for professionals and students alike, offering cutting-edge tools for 2D and 3D mapping, geoprocessing, and real-time data integration. With its intuitive ribbon interface, seamless integration with ArcGIS Online, and support for Python scripting, ArcGIS Pro is tailored for both beginners and seasoned GIS experts. Whether you’re managing urban planning projects, analyzing environmental data, or building sophisticated geospatial models, this software provides the flexibility and power you need. Join us as we dive into this comprehensive review of ArcGIS Pro, exploring its features, performance, and how it is reshaping the future of GIS workflows. ArcGIS Pro Software Review ArcGIS Pro, Esri’s flagship desktop GIS software, is a game-changer in the field of geospatial technology. With its modern design, advanced functionalities, and powerful analytical capabilities, it has become the preferred tool for professionals, educators, and GIS enthusiasts worldwide. This cutting-edge platform seamlessly integrates 2D and 3D mapping, enabling users to create visually stunning and highly detailed maps. Whether you’re conducting environmental research, managing urban development, or analyzing demographic trends, ArcGIS Pro delivers robust tools to meet your needs. Here’s an in-depth review of ArcGIS Pro, covering its key strengths, weaknesses, and overall usability. GO TO ArcGIS PRO Rating 4.9/5 Read More: ERDAS Imagine – Revolutionizing Geospatial Imaging and Analysis 1. True 3D Integration with Local and Global Scenes in ArcGIS Pro Gone are the days when working with 3D data required switching between ArcScene or ArcGlobe. With ArcGIS Pro, 2D and 3D workflows are seamlessly unified, revolutionizing how GIS professionals approach geospatial analysis. Now, users can easily convert 2D data to 3D or synchronize both formats without breaking a sweat. ArcGIS Pro brings 3D mapping to everyone’s fingertips with tools for editing, creating movie timelines, and designing interactive web scenes. From visualizing underground pipelines to managing utilities and countless other GIS applications, this software elevates industries into the third dimension with ease and efficiency. Switching between platforms used to be a hassle—drag-and-drop functionality between ArcScene and ArcMap was nonexistent. But with ArcGIS Pro, all your 3D data integrates effortlessly within local and global scenes, streamlining the entire process. This advanced 3D integration not only saves time but also enhances productivity, making ArcGIS Pro the ultimate tool for modern GIS professionals. Whether you’re mapping terrain, analyzing elevation, or creating stunning visuals, ArcGIS Pro ensures that working in 3D has never been this smooth—or this powerful. 2. Build Realistic Rooftops in 3D with ArcGIS Pro Unleash your inner adventurer with ArcGIS Pro and its powerful 3D building tools. Whether you’re visualizing urban landscapes or designing complex structures, ArcGIS Pro makes creating realistic rooftops in 3D an effortless experience. With its sleek rendering capabilities, ArcGIS Pro allows you to define roof types and other structural details with precision. All it takes is a normalized Digital Surface Model (nDSM), and the software takes care of the rest, transforming your data into stunning 3D rooftops. This tool isn’t just about aesthetics—it’s about functionality. From measuring distances between buildings to planning intricate designs, ArcGIS Pro brings realism to your projects. Imagine a 13-meter rooftop jump—can you make it? With the accuracy and detail provided by ArcGIS Pro, you can calculate and visualize every detail of your project. For GIS professionals working in urban planning, architecture, or 3D modeling, ArcGIS Pro’s 3D rooftop capabilities are an invaluable asset. Say goodbye to tedious manual calculations and hello to automated, realistic 3D visualizations. Read More: Google Earth Pro – Explore and Discover the Planet 3. Access to ArcGIS Online with ArcGIS Pro Working with ArcGIS Pro means instant access to the robust features of ArcGIS Online, Esri’s cloud-based platform for creating maps and apps. While signing in to your ArcGIS Online account is a required first step, it’s a small trade-off for the powerful capabilities it unlocks. With ArcGIS Online, creating web maps and apps is remarkably simple. Whether you’re designing tools for field teams, office staff, or community projects, ArcGIS Online provides intuitive apps tailored to your needs. Publish 2D views or stunning 3D web scenes, and customize every detail using Esri’s JavaScript API or the powerful Arcade language for defining symbols and behaviors. The integration doesn’t stop there. ArcGIS Pro lets you leverage online credits from ArcGIS Online for advanced tasks, such as geoprocessing, spatial analysis, and publishing workflows. From sculpting maps in the cloud to deploying them seamlessly for your organization, ArcGIS Online ensures collaboration and data sharing are easier than ever. For GIS professionals, the synergy between ArcGIS Pro and ArcGIS Online is a game-changer, making geospatial analysis and cloud mapping accessible and efficient. 4. Faster Loading Imagery with ArcGIS Pro Handling georeferenced imagery from drones and satellites has always been a challenge, but ArcGIS Pro is making strides in this area. With improved compatibility and functionality, ArcGIS Pro is now better equipped to process high-resolution imagery from sources like DJI drones and satellite data. For organizations utilizing drones, ArcGIS Pro integrates seamlessly with Drone2Map, making it easier to process 3D data collected from aerial surveys. Whether it’s terrain modeling or structural analysis, this compatibility ensures smooth workflows for drone imagery users. When working with satellite data, ArcGIS Pro can process XML files, enhancing its ability to manage large datasets effectively. While drag-and-drop functionality isn’t yet supported for XML files—something available in tools like SNAP—it’s clear that ArcGIS Pro is becoming more versatile in handling satellite and drone imagery. These enhancements in imagery processing make ArcGIS Pro a more reliable choice for professionals working with georeferenced data, ensuring faster and more efficient analysis for GIS applications. Read More: Top 15 Imagery Analyst Interview Questions & Answers 5. Georeference Like a Pro with Automatic Georeferencing in ArcGIS Pro The introduction of automatic georeferencing in ArcGIS Pro piqued our interest, and we couldn’t wait to put it to the test. But … Read more

Google Earth Pro – Explore and Discover the Planet

Google Earth Pro

Imagine being able to explore the farthest corners of the Earth, travel back in time to view historical landscapes, or measure vast terrains with precision—all without leaving your desk. Google Earth Pro makes this possible, combining cutting-edge technology with user-friendly tools to offer an unmatched virtual exploration experience. Once a paid tool, Google Earth Pro is now available for free, making its advanced features accessible to everyone. Whether you’re a curious traveler, a researcher, or an educator, this software allows you to dive deep into the world’s geography with high-resolution satellite imagery, 3D models, historical views, and much more. Google Earth Pro Review Google Earth Pro is a remarkable tool that allows users to explore the world from their desktops. Once a premium product, it is now available for free, making advanced mapping, visualization, and geographic exploration accessible to everyone. With its powerful features and intuitive interface, Google Earth Pro has become a favorite among educators, researchers, travelers, and geography enthusiasts. Here’s an in-depth review of Google Earth Pro, covering its key strengths, weaknesses, and overall usability.   Go To Google Earth Pro Rating: 4.7/5 1. High-Resolution Satellite Imagery Explore detailed images of cities, landscapes, and remote areas with incredible clarity. You can zoom in to street-level details or zoom out to view the entire planet. 2. Historical Imagery Time travel with the historical imagery feature, which allows you to view changes in landscapes and cities over time—perfect for researchers and history buffs. 3. Advanced Measuring Tools Accurately measure distances, areas, and elevations using intuitive tools, making it useful for urban planning, land surveying, and environmental studies. 4. 3D Building Views Explore 3D models of landmarks, cities, and terrains, giving a lifelike view of locations around the globe. 5. Video Creation Tools Record and create high-definition tours of your explorations to share with others or use in presentations. Strengths of Google Earth Pro User-Friendly Interface: Designed for both casual users and professionals, it offers an intuitive experience that requires little to no training. Free Accessibility: Previously a paid product, Google Earth Pro is now entirely free, providing premium features without any cost barriers. Versatile Applications: From virtual travel and education to environmental research and disaster management, the tool has a wide range of uses. Comprehensive Coverage: With global coverage and frequent updates, it provides one of the most detailed and current visualizations of the Earth. Read Also: ERDAS Imagine – Revolutionizing Geospatial Imaging and Analysis Difference Between Google Earth and Google Earth Pro Google Earth and Google Earth Pro are two versions of the same powerful geospatial tool offered by Google. While both allow users to explore the planet using satellite imagery, maps, and 3D terrain, there are significant differences in functionality and target audience. Here’s a detailed comparison: 1. Cost Google Earth: Free for all users. Google Earth Pro: Previously a paid version, it is now available for free since 2015, offering advanced features at no cost. 2. Purpose and Audience Google Earth: Designed for casual users, travelers, and geography enthusiasts who want to explore the world virtually. It offers basic features like map navigation, search, and 3D visualization. Google Earth Pro: Geared toward professionals, researchers, and advanced users who require tools for data analysis, map creation, and presentations. Feature Google Earth Google Earth Pro High-Resolution Imagery Available Available 3D Buildings and Terrain Available Available Historical Imagery Limited Access Full Access Advanced Measurement Tools Basic distance measurement Advanced tools for area, radius, and polygon measurements Map Creation and Printing Basic map printing High-resolution map printing with custom annotations Video Creation Not available Record and export HD virtual tours GIS Data Import Not available Import GIS formats like shapefiles (.shp) and KML/KMZ files Data Analysis Not available Advanced tools for geographic and demographic analysis 4. System Requirements Google Earth: Works on most devices, including web browsers, desktops, and mobile apps, requiring minimal system resources. Google Earth Pro: Requires a desktop installation and is more resource-intensive due to its advanced features. 5. Usability Google Earth: Simplified interface and features for casual exploration and personal use. Google Earth Pro: Includes professional-grade tools with more customization options, making it ideal for advanced projects like urban planning, environmental studies, and real estate analysis. What Can You Do with Google Earth Pro? Google Earth Pro is a powerful geospatial tool packed with features that enable users to explore, analyze, and create customized geographic content. Whether you’re a casual user or a professional, the software offers a wide range of applications across various fields. Here’s what you can do with Google Earth Pro: Explore High-Resolution Imagery: View detailed satellite images and 3D models of cities, landmarks, and natural terrains. Access Historical Imagery: Analyze changes in landscapes and urban development over time. Measure Distances and Areas: Use advanced tools for precise calculations of lengths, areas, and elevations. Create Custom Maps: Add annotations, shapes, and overlays to design personalized maps. Print High-Resolution Maps: Export maps in high quality for presentations or reports. Record Virtual Tours: Create and export HD tours with navigation paths and voice narrations. Import GIS Data: Work with shapefiles, KML/KMZ files, and other geospatial data formats. Conduct Spatial Analysis: Visualize and interpret geographic and demographic data. Share Content: Export maps, tours, and data files for collaboration or sharing. Study Environmental Changes: Monitor climate impacts, deforestation, or urban sprawl using overlay features. Enhance Learning: Use interactive tools for education and storytelling in geography, history, and science. How to Download Google Earth Pro for Free Once a premium tool for businesses, Google Earth Pro is now entirely free for everyone. To get started, follow these simple steps: Visit the Google Earth Pro Website: Go to the official Google Earth page to access the download link. Accept the Privacy Policy: Review and agree to the service’s privacy terms. Download the Application: Click the download button to get the installer for your operating system. Install and Launch: Follow the on-screen instructions to install the software and begin exploring the world for free. Enjoy all the advanced features of … Read more

ERDAS Imagine – Revolutionizing Geospatial Imaging and Analysis

ERDAS Imagine

In today’s fast-paced world, where spatial data plays a pivotal role in decision-making, having the right tools for geospatial imaging and analysis is more critical than ever. ERDAS IMAGINE, a flagship software by Hexagon Geospatial, stands out as a game-changer in this domain. Designed to cater to professionals in remote sensing, photogrammetry, and GIS, ERDAS IMAGINE consolidates cutting-edge functionalities into one intuitive platform, enabling users to extract valuable insights from complex spatial data. Whether you’re analyzing satellite imagery for environmental changes, processing LiDAR data for urban planning, or creating 3D terrain models for infrastructure development, ERDAS IMAGINE empowers you to achieve unparalleled precision and efficiency. This blog delves into how ERDAS IMAGINE is revolutionizing the field of geospatial imaging and analysis, making it an indispensable tool for industries ranging from agriculture to disaster management. ERDAS IMAGINE Software Review ERDAS IMAGINE is a highly regarded geospatial analysis software suite, primarily used for remote sensing, photogrammetry, and geospatial data processing. Known for its comprehensive set of tools and robust processing capabilities, it is widely utilized in various industries, including environmental monitoring, urban planning, defense, agriculture, and disaster management. Here’s an in-depth review of ERDAS IMAGINE, covering its key strengths, weaknesses, and overall usability. Go To ERDAS Imagine Rating: 4.5/5 1. User-Friendly Interface While the software is packed with complex tools, it maintains a user-friendly interface that allows both novice and expert users to perform tasks efficiently. It provides easy access to workflows and supports intuitive tools for managing and analyzing large datasets. The software’s interface can be customized according to user preferences, making it adaptable for different user needs. Read More: Imagery Analyst Interview Questions & Answers 2. LiDAR Analysis With robust tools for LiDAR data, ERDAS IMAGINE facilitates the processing and interpretation of point cloud data for: Terrain and Surface Modeling: Generates detailed terrain and surface models for hydrology, forestry, and urban studies. Feature Extraction: Identifies objects like trees, buildings, and power lines from dense point clouds. Intensity Analysis: Leverages the intensity values in LiDAR to understand material properties and surface reflectivity. Point Cloud Classification: Segments and classifies LiDAR data for applications like vegetation analysis and ground feature delineation. Read More: Aerial Photogrammetrist Interview Questions & Answers 3. Vector Analysis While primarily an image processing tool, ERDAS IMAGINE supports vector data integration for hybrid workflows, including: Overlay Analysis: Combines raster and vector layers for spatial analysis and decision-making. Vector Digitization: Allows manual or automated creation of vector features directly on imagery. Attribute Management: Facilitates the management and analysis of vector attributes in conjunction with raster datasets. Read More: Map Maker Interview Questions & Answers 4. Radar Processing ERDAS IMAGINE provides advanced capabilities for processing radar data, especially Synthetic Aperture Radar (SAR), making it indispensable for specific applications like: Interferometric SAR (InSAR): Creates elevation models or detects surface deformation using radar phase differences. Polarimetric Analysis: Analyzes radar polarimetry to classify and interpret surface features. Speckle Reduction: Reduces noise in radar imagery while preserving feature integrity. Flood Mapping and Disaster Analysis: Uses radar imagery’s ability to penetrate clouds for timely disaster response. Read More: Field Map Editor Resume Template 5. Remote Sensing ERDAS IMAGINE is renowned for its ability to process and analyze satellite and aerial imagery with high precision. This functionality includes: Image Classification: Supports supervised and unsupervised classification methods to categorize land cover or features. Change Detection: Enables users to identify and quantify changes in landscapes over time using multi-temporal imagery. Spectral Analysis: Provides tools like spectral indices (e.g., NDVI for vegetation analysis) and advanced spectral libraries for identifying material compositions. Orthorectification: Corrects geometric distortions in imagery for accurate spatial representation. Hyperspectral and Multispectral Analysis: Allows processing of imagery with hundreds of bands for detailed environmental and material studies. Read More: Field Map Editor Interview Questions & Answers 6. Photogrammetry ERDAS IMAGINE integrates photogrammetric tools to handle imagery from aerial and drone-based sensors, enabling: Digital Elevation Model (DEM) Generation: Creates elevation models using stereoscopic imagery for terrain analysis. Orthophoto Creation: Combines imagery and elevation data to produce spatially accurate, corrected aerial images. 3D Feature Extraction: Extracts 3D features like buildings and terrain from imagery, essential for urban planning and infrastructure development. Mosaic Production: Merges multiple images into seamless mosaics while maintaining consistent radiometric properties. Read More: Data Mapper Interview Questions & Answers ERDAS Imagine History ERDAS IMAGINE has a rich history rooted in innovation and the advancement of geospatial technology. Over the decades, it has evolved from a pioneering concept to a comprehensive tool, widely recognized for its capabilities in remote sensing, photogrammetry, and GIS. Let’s take a journey through its key milestones: 1978 – The Beginning with ERDAS 4 The story began with the release of ERDAS 4 in 1978. Designed to run on Cromemco microcomputers, it was ahead of its time, supporting large digitizing tablets and 80-megabyte hard drives—a significant technological leap for its era. 1980 – ERDAS 400 Two years later, ERDAS 400 was introduced, marking a step forward in geospatial processing. In an era when computers were both expensive and rare, this system became an essential tool for prestigious organizations such as NASA, the US Forest Service, and the US Environmental Protection Agency. 1982 – ERDAS 7 and GIS Integration The release of ERDAS 7 in 1982 was a breakthrough moment for the industry. It facilitated a collaboration with ESRI’s ARC/INFO, linking remote sensing with GIS mapping. This integration allowed users to harness the power of geospatial analysis in entirely new ways. The Introduction of ERDAS IMAGINE Building on its legacy, ERDAS IMAGINE was launched as the flagship product, revolutionizing the geospatial industry. The introduction of a graphical user interface (GUI) made it easier than ever for users to visualize spatial data, create maps, and perform sophisticated image processing. Becoming Part of Hexagon Today, ERDAS IMAGINE is part of Hexagon’s extensive portfolio, which includes solutions like Hexagon GeoMedia, Leica Geosystems, and M.App Enterprise. This integration has further enhanced its capabilities, cementing its role as a leader in geospatial technology. Strengths of ERDAS IMAGINE All-in-One Solution: ERDAS … Read more

Top 15 LIDAR Technician Interview Questions & Answers

LIDAR Technician

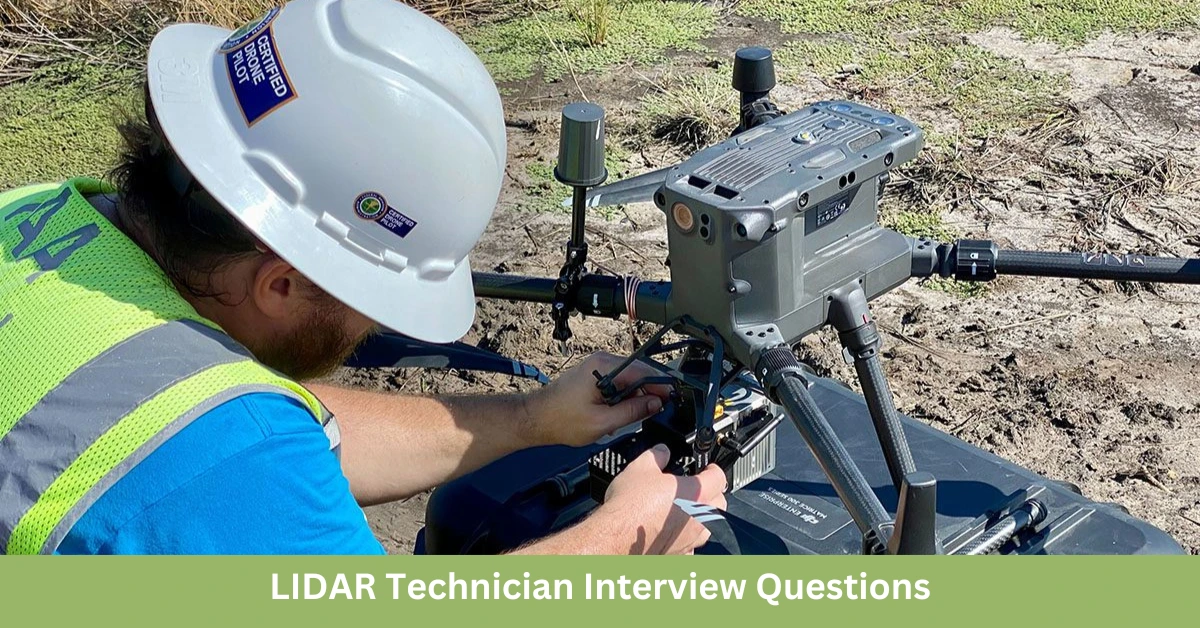
A LIDAR Technician is responsible for collecting, processing, and analyzing LIDAR (Light Detection and Ranging) data to create precise 3D maps and models. LIDAR is used in various industries, including forestry, environmental monitoring, and urban planning, for creating high-resolution topographical maps. If you’re preparing for a LIDAR Technician interview, these top 15 LIDAR Technician interview questions and answers will help you highlight your technical skills and experience. LIDAR Technician Interview Questions & Answers Here’s a comprehensive list of 15 LIDAR Technician Interview Questions & Answers along with detailed answers to help you prepare and impress your interviewers. 1. What is the role of a LIDAR Technician? Answer: A LIDAR Technician operates LIDAR systems to collect data from laser sensors, processes this data to create detailed 3D maps or models, and ensures the data’s accuracy and completeness for various applications, such as topography, forestry, and urban planning. 2. What types of LIDAR systems have you worked with? Answer: I have experience with several LIDAR systems, including: Terrestrial LIDAR for ground-based scanning. Aerial LIDAR mounted on drones or aircraft for large-scale mapping. Mobile LIDAR integrated into vehicles for road and infrastructure surveying. 3. What is the principle behind LIDAR technology? Answer: LIDAR works by emitting laser pulses from a sensor and measuring the time it takes for the pulses to bounce back from objects. This time-of-flight data is used to calculate distances and create precise 3D models of the scanned area. 4. How do you process and analyze LIDAR data? Answer: To process and analyze LIDAR data, I: Use software such as LIDAR360, CloudCompare, and ArcGIS to process raw point clouds. Clean and filter the data to remove noise and irrelevant information. Classify the point cloud into different categories like ground, vegetation, and buildings. Create digital elevation models (DEMs) or 3D models for further analysis. Read Also: Top 15 Cartography Technician Interview Questions and Answers 5. What is point cloud data, and how do you work with it? Answer: Point cloud data consists of a collection of data points in 3D space, each with an XYZ coordinate, representing the surface of an object or environment. I work with point clouds by: Importing them into specialized software. Applying classification algorithms to identify different features. Visualizing and converting point clouds into usable data formats like DEMs or 3D models. 6. What challenges do you face when working with LIDAR data, and how do you overcome them? Answer: Challenges include: Noise in data: I use filtering techniques to clean the data. Large data volumes: I use efficient processing software and break data into manageable chunks. Environmental factors: I ensure optimal scanning conditions and use multiple data sources for accuracy. Read Also: 15 Cartographic Drafter Interview Questions and Answers 7. What software tools are you proficient in for processing LIDAR data? Answer: I am proficient in several LIDAR processing tools, including: LAStools: For efficient LIDAR data processing and manipulation. ArcGIS: For creating maps and analyzing geospatial data. FUSION: A specialized tool for LIDAR data analysis. Global Mapper: For processing and visualizing point cloud data. 8. How do you ensure the accuracy of LIDAR data? Answer: To ensure data accuracy, I: Calibrate LIDAR sensors before each survey. Conduct ground truthing by comparing LIDAR data with physical measurements. Use control points or reference data to validate the results. Read Also: 15 Cartographic Designer Interview Questions 9. Can you explain the difference between airborne and terrestrial LIDAR? Answer: Airborne LIDAR is mounted on an aircraft or drone and is used for large-area surveys, such as mapping forests or topography. Terrestrial LIDAR is ground-based and used for detailed scanning of smaller areas, such as buildings or infrastructure. 10. How do you handle large datasets generated from LIDAR surveys? Answer: I handle large datasets by: Using high-performance computers and cloud storage for data management. Breaking down large datasets into smaller, manageable sections. Employing software that can handle big data efficiently, such as LAStools and CloudCompare. Read Also: Top 15 Cadastral Mapper Interview Questions 11. What are some common applications of LIDAR technology? Answer: LIDAR is used in a variety of fields, including: Topography and mapping: Creating precise 3D models and elevation maps. Forestry: Analyzing vegetation and forest structure. Archaeology: Mapping ancient structures and landscapes. Urban planning: Mapping infrastructure and planning for development. 12. How do you ensure that LIDAR data is compatible with other geospatial data? Answer: I ensure compatibility by: Standardizing coordinate systems across all datasets. Converting LIDAR data into widely accepted formats like LAS or LAZ. Integrating LIDAR data with GIS software for further analysis and visualization. Read Also: Top 17 Cartographer Interview Questions 13. How do you perform quality control during LIDAR data collection? Answer: I perform quality control by: Checking for calibration issues with the LIDAR system. Monitoring data collection conditions (e.g., weather, altitude). Verifying data completeness and accuracy during field surveys. 14. How do you work with field crews during LIDAR data collection? Answer: I coordinate with field crews to ensure that: Proper GPS equipment is used for ground control points. The LIDAR system is properly mounted and calibrated. Field data is accurately recorded and aligned with the LIDAR data collected. Read Also: 15 Must-Ask Interview Questions for Cartographer 15. Can you share a successful LIDAR project you’ve worked on? Answer: I worked on a project mapping coastal erosion, where we used airborne LIDAR to create detailed elevation models of the shoreline. The high-resolution data allowed for accurate assessments of erosion rates and helped inform conservation strategies. Conclusion A LIDAR Technician plays a critical role in collecting and processing LIDAR data for creating precise 3D models and maps. These top 15 LIDAR Technician interview questions and answers will help you prepare for an interview and demonstrate your expertise in LIDAR technology, data processing, and field operations. Stay connected for more career tips and insights into the world of geospatial technology!

QGIS Reviews 2024: Details, Pricing, & Features

QGIS

QGIS (Quantum GIS) is an open-source Geographic Information System (GIS) software widely used by GIS professionals and enthusiasts around the world. It offers a powerful, free alternative to commercial GIS software like ArcGIS. QGIS provides excellent tools for data visualization, spatial analysis, and map creation. In this blog, we will discuss QGIS’s features, advantages, drawbacks, pricing, and other key aspects. Key Features of QGIS QGIS offers several features that make it a great GIS tool. Here are some of the main features: Open-Source Software: QGIS is completely open-source, making it free and accessible to everyone. Anyone can download, install, and modify it. Data Compatibility: QGIS supports almost every type of geospatial data format, including shapefiles, GeoJSON, KML, and more. It also works with spatial databases like PostGIS and SpatiaLite. Advanced Spatial Analysis: QGIS includes tools that can handle advanced spatial analysis, interpolation, and proximity analysis. Customizable Interface: The interface of QGIS is fully customizable. You can arrange toolbars, menus, and panels according to your needs. Plugins: QGIS has many plugins available to add new features and functionalities. You can install them from the QGIS plugin repository. Pros of QGIS Free and Open-Source: The biggest advantage of QGIS is that it’s completely free. Anyone can download and use it without any licensing fees. User-Friendly Interface: QGIS has a user-friendly interface that makes it easy for even new users to learn and get started. Extensive Community Support: QGIS has a large and active community, with plenty of forums, tutorials, and documentation available to help users. Cross-Platform Compatibility: QGIS works on Windows, macOS, and Linux, making it accessible to users on different platforms. Scalability: QGIS can handle both large and small datasets efficiently. It works well with large datasets, which is important for many GIS applications. Cons of QGIS Performance with Large Datasets: QGIS can sometimes be slow when dealing with very large datasets, especially when performing complex analyses. Learning Curve: While QGIS is user-friendly, there can still be a learning curve for some of its more advanced features. Limited Advanced Geospatial Tools: QGIS may not offer the same level of advanced tools as ArcGIS, although plugins can add some of these features. Pricing of QGIS QGIS is completely free. It is open-source software that you can download and use without any cost. There are no subscription fees or licensing fees involved. Additionally, the tutorials and guides available on the QGIS community website are also free. User Experience with QGIS QGIS is relatively easy to use, especially for those who are looking to perform basic GIS tasks. If you are a beginner, there are plenty of online tutorials and learning resources that will help you understand the features of QGIS. For more advanced users, QGIS is a powerful tool capable of performing complex spatial analysis and map design. Performance and Speed of QGIS QGIS’s performance largely depends on your system configuration and dataset size. It works very fast and efficiently with smaller datasets, but it can become slow with larger datasets (such as millions of features). However, there are performance optimization techniques and configurations available for handling large data more effectively. Qgis Vs ArcGIS The main difference between QGIS and other GIS tools like ArcGIS is that QGIS is open-source and free, while ArcGIS is a licensed software. While ArcGIS offers some advanced tools and official support, QGIS has a strong community and plenty of plugins that make it highly versatile. Plus, QGIS does not require a subscription or license, which is a major advantage for users on a budget. System Requirements for QGIS Minimum system requirements to run QGIS: Operating System: Windows 7 or later, macOS 10.10 or later, Linux Processor: Intel i3 or equivalent RAM: 4GB minimum (8GB recommended) Hard Drive Space: 1GB of free space Graphics: Any GPU with OpenGL 2.0 support Conclusion: Should You Use QGIS? QGIS is an excellent open-source GIS tool that is suitable for GIS professionals, researchers, and beginners alike. Its biggest advantage is that it’s completely free and highly customizable. While some advanced features in ArcGIS may not be available in QGIS, it is still an excellent choice for those who need powerful spatial analysis tools on a budget. Rating: 4.5/5 You can download QGIS from the official website and try it out for free. If you’re a GIS professional, this software can enhance your workflow and make your GIS tasks more efficient and powerful. Frequently Asked Questions (FAQs) Q: Does QGIS work on Windows, macOS, and Linux? A: Yes, QGIS works on all major platforms, including Windows, macOS, and Linux. Q: Is QGIS free to use? A: Yes, QGIS is open-source and completely free to use. Q: Does QGIS have a learning curve? A: While QGIS is user-friendly, there is a slight learning curve for some of its advanced features.

7 Best Differences Between GRASS GIS and QGIS in 2024

GRASS GIS and QGIS

In the rapidly evolving world of Geographic Information Systems (GIS), two prominent software tools continue to stand out for handling spatial data: GRASS GIS and QGIS. Both are widely recognized for their capabilities in spatial analysis, data visualization, and cartography. However, despite their common features, they each offer distinct functionalities that make them suitable for different users and use cases. In this post, we’ll explore the key differences between GRASS GIS and QGIS in 2024, highlighting their strengths and how they compare in practical scenarios. 1. Definition and Purpose GRASS GIS (Geographic Resources Analysis Support System) is a powerful, open-source GIS software that has been a cornerstone in spatial data analysis for decades. Known for its advanced analytical capabilities, GRASS GIS provides users with over 300 modules for raster, vector, and geospatial data manipulation. It is particularly popular among researchers and institutions needing complex geospatial analysis. QGIS, originally known as Quantum GIS, is another open-source software platform that is user-friendly and designed to meet a wide range of GIS needs. While it offers robust analytical tools, QGIS is best known for its versatility in editing, visualizing, and composing spatial data. It’s a favorite among beginners and professionals alike due to its ease of use and seamless integration with other platforms, including GRASS GIS. 2. How they work GRASS GIS excels in handling large-scale geospatial analysis, thanks to its comprehensive toolkit of over 300 modules. This system is built to support both raster and vector data processing, making it ideal for detailed geographical research, environmental modeling, and spatial data analysis. However, its complex interface can present a steep learning curve for new users. QGIS, on the other hand, offers a more intuitive and user-friendly environment. While it supports both raster and vector layers, QGIS simplifies data editing, spatial analysis, and map creation through its integrated tools and plug-ins. It’s also highly adaptable, allowing users to customize workflows and use external plug-ins to enhance functionality. Read Also: ArcGIS 10.8 Free Download Latest Version 2024 3. Symbols and Visualization GRASS GIS: Visualization is more utilitarian in GRASS GIS. It primarily handles raw geospatial data, meaning that while it’s powerful for analysis, it does not prioritize the creation of visually appealing maps. Users may need to use external tools for adding rich symbology or converting data into more accessible visual formats. QGIS: When it comes to creating beautiful maps, QGIS shines. Its built-in symbology tools allow users to easily represent geographical features with custom symbols, colors, and styles. Whether you’re creating thematic maps or complex visualizations, QGIS offers the flexibility to create professional-grade cartography without the need for additional software. 4. Geometrical Editing GRASS GIS: Editing geometries in GRASS GIS can be challenging, especially for those unfamiliar with the system. Altering features often requires advanced knowledge, and the interface can be restrictive when it comes to modifying or updating spatial data. For example, converting geometries like lines to polygons can be complex without deep technical know-how. QGIS: With QGIS, geometrical editing is straightforward. It offers easy-to-use tools for manipulating geometries, converting lines to polygons, and adding or editing attribute data. The ability to freely edit data makes QGIS more flexible for day-to-day spatial data manipulation tasks, offering a smoother experience for users who need to regularly alter spatial features. 5. Data Entry and Management GRASS GIS: When working with data in GRASS GIS, users need to create specific fields for data entry (integer, text, double, etc.), but once these fields are created, they cannot be renamed or easily edited. This can be restrictive for workflows requiring frequent modifications, as new fields need to be created and data transferred manually. QGIS: QGIS makes data entry and management easier, thanks to its Table Manager Plug-in, which allows users to rename, edit, and manage fields after they’ve been created. This added flexibility in data entry makes QGIS a more user-friendly platform, especially for projects requiring regular updates or adjustments to datasets. 6. Data Interoperability GRASS GIS: Known for its strong interoperability, GRASS GIS offers excellent support for integrating various data formats and inputs. Its ability to work with multiple data types makes it a popular choice for research institutions and professionals needing to consolidate and process data from diverse sources. QGIS: While QGIS also supports a wide range of data formats and can work well with other systems, it doesn’t offer the same level of data interoperability as GRASS GIS. However, QGIS compensates for this with its wide range of plug-ins that allow users to extend its capabilities, including connecting it with GRASS GIS itself for advanced analysis. 7. Target Audience GRASS GIS is best suited for advanced users, researchers, and professionals requiring in-depth spatial data analysis. It is a powerful tool for those who need to perform large-scale environmental and geospatial modeling but may be overwhelming for beginners due to its steep learning curve. QGIS, in contrast, appeals to a broader audience, from GIS professionals to beginners. Its user-friendly interface and wide range of tools make it suitable for day-to-day spatial data management, cartography, and analysis tasks. For users who don’t require the advanced capabilities of GRASS GIS, QGIS is a more accessible and flexible option. Conclusion: Which One Should You Choose? Choosing between GRASS GIS and QGIS depends on your specific needs and expertise. If you require deep geospatial analysis, have experience with complex GIS software, and need a robust toolkit for scientific research, GRASS GIS is an excellent choice. On the other hand, if you’re looking for a more user-friendly platform that excels in map-making, data editing, and everyday GIS tasks, QGIS is likely to be more suitable. In 2024, both GRASS GIS and QGIS remain top-tier open-source solutions for handling geographical information, offering different strengths that cater to varied user requirements. Whether you’re a researcher needing powerful analysis tools or a GIS technician focusing on spatial data management, understanding the differences between these two platforms will help you make the right choice for your projects. Top 10 educational robots for kids in … Read more

Unlock Peak GIS Performance: 7 Powerful Features of ArcGIS Monitor 2024.0’s New Metrics Comparison Workflow

ArcGIS Monitor 2024.0

In today’s fast-paced GIS environment, keeping track of the health, performance, and overall efficiency of your Enterprise GIS is critical with ArcGIS Monitor 2024.0. ArcGIS Monitor has been a trusted solution for administrators, offering detailed metrics that help optimize both GIS and IT investments. With the release of ArcGIS Monitor 2024.0, Esri has introduced a new, simplified workflow that makes comparing metrics across similar components easier than ever. What is ArcGIS Monitor 2024.0? ArcGIS Monitor 2024.0 is a specialized tool designed to help administrators track and optimize the performance, health, and usage of ArcGIS Enterprise deployments. It collects real-time metrics on system components like hosts, ArcGIS Server sites, and web services, allowing administrators to monitor performance, prevent downtime, and improve system efficiency. The 2024.0 version introduces new workflows, such as the ability to compare metrics between similar components, providing a streamlined process for analyzing and maintaining the health of GIS infrastructure. What’s New in ArcGIS Monitor 2024.0? The latest release introduces a powerful feature allowing users to compare metrics of similar components—such as hosts, ArcGIS Server sites, or web services—with just a few clicks. This eliminates the need for manually configuring new dataview queries, streamlining the process and making it more accessible to both seasoned and novice administrators. Here’s a step-by-step guide to using this new feature: 7 powerful features of ArcGIS Monitor 2024.0 1. Effortless Metric Comparison The new workflow allows you to quickly compare metrics between similar components like hosts, ArcGIS Server sites, or web services, streamlining performance analysis without needing complex data-view queries. 2. Customizable Analysis Views You can easily copy the compared metrics to a new or existing analysis view, giving you flexibility to customize and modify metrics to suit your monitoring needs. 3. Enhanced Component Selection ArcGIS Monitor 2024.0 enables you to select up to 10 components at once for comparison, making it easier to analyze multiple instances of similar components in one go. 4. Reduced System Downtime By providing quick access to detailed metrics comparisons, administrators can identify performance bottlenecks early, helping to prevent unexpected system downtime and improve overall stability. 5. Simplified Monitoring Interface The intuitive interface reduces the learning curve for new users, allowing both experienced and novice GIS admins to seamlessly navigate and utilize the tool for efficient monitoring. 6. Real-Time Performance Insights With real-time data monitoring, ArcGIS Monitor helps ensure that your system’s performance is always up to date, allowing administrators to make informed decisions based on the latest insights. 7. Convenient Licensing via Esri Store ArcGIS Monitor 2024.0 is now available for purchase online through the Esri Store, making it easier to obtain new licenses or scale up by adding additional cores without any hassle. Read Also: Comprehensive Guide to GIS: Technology, Components, Applications, Software, Uses, Challenges, and Future Prospects Step-by-Step Workflow: Sign In to ArcGIS Monitor: First, log in to your ArcGIS Monitor dashboard and navigate to the Monitoring tab. Select Similar Components: From the component list, select two or more components of the same type (you can choose up to 10). As soon as you select them, you’ll notice a new button called Compare Metrics in the upper-right corner of the component list. Image Credit: esri.com (https://www.esri.com/arcgis-blog/products/monitor/administration/arcgis-monitor-quickly-compare-component-metrics/) Compare Metrics: After clicking the Compare Metrics button, a panel will display the selected components on the left, and their respective metrics will be shown on the right. These metrics mirror the ones shown in each component’s overview panel, giving you a side-by-side comparison. You also have the option to remove components from the list if needed. Image Credit: esri.com (https://www.esri.com/arcgis-blog/products/monitor/administration/arcgis-monitor-quickly-compare-component-metrics/) Create an Analysis View: If you want to save these comparisons for further analysis, click the Copy to an Analysis button in the upper-right corner. You can either create a new analysis view or add the metrics to an existing one. Image Credit: esri.com (https://www.esri.com/arcgis-blog/products/monitor/administration/arcgis-monitor-quickly-compare-component-metrics/) Modify and Edit Your Analysis: Navigate to the Analysis tab, select your analysis view, and make any modifications as needed. The new metrics are fully customizable, allowing you to adjust them like any other element in the analysis view. This workflow significantly simplifies the task of comparing metrics across similar components, empowering administrators to quickly spot inefficiencies, performance bottlenecks, or potential downtime risks. Purchase ArcGIS Monitor from the Esri Store In another exciting update, ArcGIS Monitor is now available for direct purchase from the Esri Store. Whether you’re a GIS admin looking to purchase a new Monitor license or a manager looking to scale with additional cores, you can now conveniently shop online. Conclusion The 2024.0 update to ArcGIS Monitor is a game-changer for GIS administrators, making it easier to compare and analyze the health of your GIS system. By introducing features that reduce system downtime and improve overall performance, ArcGIS Monitor continues to be an indispensable tool for any Enterprise GIS deployment. Be sure to explore these new features and optimize your system’s performance today. For more insights and updates on GIS technologies, stay tuned to THEGISJOURNAL.COM!

ArcGIS 10.8 Free Download Latest Version 2024

arcgis 10.8 free download latest version 2024

ArcGIS 10.8 is a powerful Geographic Information System (GIS) software that is widely recognized for its robust capabilities in spatial analysis, mapping, and data management. It is an essential tool used by professionals across various industries, including urban planning, environmental management, and disaster response, to make informed decisions based on geographical data. This blog is designed to guide you through the process of downloading ArcGIS 10.8 safely and securely, ensuring that you get the official software without any complications. Click Here To Free Download Esri ArcGIS Desktop 10.8 Free Download :: Extract the zip file using WinRAR or WinZip or by default Windows command. :: Password-> 123 :: Open Installer and accept the terms and then install the program. :: Fix the folder and follow the instructions in a text file. Top 10 educational robots for kids in 2024.