LiDAR vs. Photogrammetry: The Ultimate 2025 Showdown (Pros, Cons & Verdict)

LiDAR vs. Photogrammetry

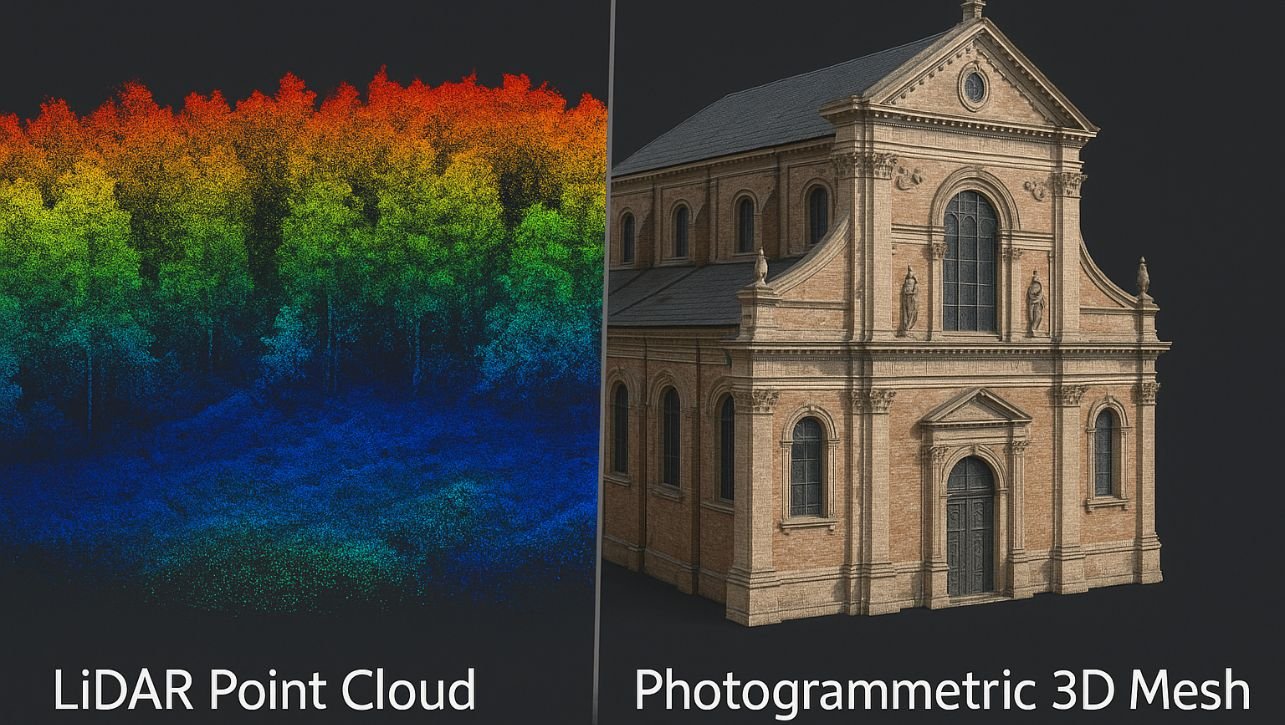
In the quest to digitally capture our world in three dimensions, two technologies reign supreme: LiDAR Vs. Photogrammetry. From creating immersive digital twins of cities to monitoring ancient archaeological sites, the demand for accurate 3D data has never been higher. But if you’re planning a drone survey, an aerial mapping project, or a ground-based scan, you face a critical decision: which technology is right for you? The choice between LiDAR and Photogrammetry isn’t about one being universally “better”—it’s about matching the right tool to your project’s specific needs, budget, and deliverables. This ultimate 2025 showdown will cut through the hype, giving you a clear, unbiased comparison to help you make the most informed decision. The 30-Second Summary: LiDAR vs. Photogrammetry Feature LiDAR (Light Detection and Ranging) Photogrammetry How It Works Measures distances with laser pulses. Calculates 3D from 2D photos (Structure from Motion). Primary Output 3D Point Cloud (x,y,z coordinates) 3D Textured Mesh & Orthomosaic Accuracy (Vegetation Penetration) Excellent. Can see through gaps to ground. Poor. Sees only the top of the canopy. Visual Realism Poor (no inherent color/texture). Excellent. Photo-realistic textures. Speed of Data Capture Very Fast (direct measurement). Slower (requires high overlap). Cost High (hardware & processing) Low to Moderate (standard cameras & software) Best For Mapping under vegetation, power lines, complex structures. Visual deliverables, large-area mapping, volume calculations.   The Deep Dive: How They Work What is LiDAR? (The Laser Ruler) LiDAR is an active remote sensing method. It works by firing hundreds of thousands of laser pulses per second at a target and measuring the time it takes for each pulse to return to the sensor. The “Point Cloud”: Each return creates a single point with precise X, Y, and Z coordinates. The result is a massive, dense “cloud” of individual points that accurately represents the scanned object or landscape. Multiple Returns: A key advantage is that a single laser pulse can have multiple returns. It can hit a leaf, then a branch, and finally the ground, capturing data at different levels. This is what allows LiDAR to “see through” vegetation. What is Photogrammetry? (The 3D Puzzle Solver) Photogrammetry is a passive method. It uses overlapping 2D photographs taken from different positions to reconstruct a 3D model. Structure from Motion (SfM): Sophisticated software identifies common points in multiple overlapping images. By triangulating the position of these points, it calculates their location in 3D space, creating a dense point cloud, which is then used to generate a 3D mesh. The Textured Mesh: The software then drapes the original photographs over the 3D mesh, creating a photorealistic, “true-color” model. Head-to-Head: The Key Comparison Factors 1. Accuracy and Detail LiDAR: Excels in vertical (Z) accuracy and capturing fine linear details like wires, pipes, and sharp building edges. It is less affected by lighting conditions or surface textures. Photogrammetry: Provides excellent horizontal (X,Y) accuracy. However, its vertical accuracy can be lower than LiDAR, especially in areas with uniform textures (like sand or grass) where the software struggles to find matching points. Verdict: LiDAR wins for vertical accuracy and capturing fine details. Photogrammetry wins for horizontal accuracy on well-textured surfaces. 2. Dealing with Vegetation and Obstructions This is LiDAR’s killer app. LiDAR: Can penetrate small gaps in vegetation to map the ground terrain below, creating an accurate Digital Terrain Model (DTM). This is non-negotiable for forestry, floodplain mapping, and archaeology. Photogrammetry: Can only see the top surface (the canopy), resulting in a Digital Surface Model (DSM). It cannot map what it cannot see. Verdict: LiDAR is the undisputed winner for any project requiring ground data in vegetated areas. 3. Visual Output and Deliverables Photogrammetry: The clear winner for visual appeal. Its outputs—orthomosaics and textured 3D meshes—are instantly recognizable and rich with visual information. This is ideal for presentations, asset inspections, and virtual tours. LiDAR: Produces a monochromatic point cloud. While color can be added by fusing LiDAR data with camera imagery (“RGB LiDAR”), it is an extra step and rarely matches the visual quality of photogrammetry. Verdict: Photogrammetry wins for visually communicative maps and models. LiDAR wins for pure geometric measurement. 4. Cost and Accessibility Photogrammetry: Has a low barrier to entry. You can start with a consumer-grade drone and a $100/month software subscription. The technology is mature and widely understood. LiDAR: Requires a significant investment. A professional drone LiDAR system can cost $30,000 – $100,000+. Processing software is also more specialized and expensive. Furthermore, it requires greater expertise to operate and process the data correctly. Verdict: Photogrammetry is far more cost-effective and accessible for most users. 5. Sunlight and Weather Dependence LiDAR: An active sensor, it can be used day or night. It can also see through some haze and light fog, though heavy rain or fog will scatter the laser beams. Photogrammetry: Requires good, consistent lighting. Shadows, glare, and overcast conditions that change between photos can ruin a dataset. Verdict: LiDAR is more reliable for time-sensitive projects and can operate in a wider range of lighting conditions. Read Also:  ArcGIS Pro vs. QGIS: The Ultimate 2025 Showdown (Pros, Cons & Verdict) Multispectral vs. Hyperspectral Imagery: A Clear-Cut Guide For 2025 8 Common Map Projections: Which One is Right for Your Map? When to Use Which: Your Project Guide Choose LiDAR If Your Project Involves: Forestry Management: Measuring timber volume, canopy structure, and creating DTMs. Infrastructure Corridors: Mapping power lines, pipelines, and rail lines through vegetation. Engineering & Construction: Capturing complex industrial sites with plenty of steelwork and piping. Flood Modeling & Hydrology: Creating highly accurate terrain models of watersheds. Archaeology: Discovering subtle ground features hidden under foliage (e.g., ancient earthworks). Choose Photogrammetry If Your Project Involves: Orthomosaic Map Creation: For high-resolution, “true-color” 2D base maps. Construction Earthworks: Calculating stockpile volumes and cut/fill quantities. Agriculture: Creating NDVI maps and monitoring crop health (requires a multispectral camera). Cultural Heritage & Film: Creating photorealistic 3D models of buildings, statues, and sites for digital archives or visual effects. Marketing & Real Estate: Creating stunning visualizations and virtual tours. The Future is Fusion: The Hybrid Approach The most powerful approach emerging in 2025 is data fusion—using both technologies on the same project. How it works: A drone equipped with both a LiDAR sensor and a high-resolution camera captures data simultaneously. The benefit: You get the geometric precision of LiDAR (e.g., an accurate DTM under … Read more
Multispectral vs. Hyperspectral Imagery: A Clear-Cut Guide For 2025

From monitoring crop health from space to detecting minute mineral deposits from the air, remote sensing allows us to see the world in ways the human eye cannot. This powerful capability hinges on detecting light beyond the visible spectrum. But not all spectral imagery is created equal. The two giants in this field are multispectral imagery and hyperspectral imagery. While they sound similar, the difference between them is not just a matter of degree—it’s a fundamental distinction in data richness and application potential. Understanding this difference is crucial for anyone in fields like agriculture, environmental science, mining, or defense. Let’s break down the “spectral” showdown. The Core Difference: A Simple Analogy Imagine you’re trying to identify a specific shade of blue paint in a hardware store. Multispectral Imaging is like being given four wide paint swatches: Red, Green, Blue, and “Not Visible.” You can tell it’s a blue, but you can’t pinpoint the exact shade (e.g., “Saxony Blue” vs. “Navy Blue”). Hyperspectral Imaging is like being given a paint fan deck with hundreds of contiguous, narrow swatches. You can match the exact shade perfectly, identifying not just “blue,” but the specific pigment and brand. This is the essence of the difference: Breadth vs. Detail. Head-to-Head: The Technical Breakdown Feature Multispectral Imagery (MSI) Hyperspectral Imagery (HSI) Spectral Bands 3 – 15 broad, discrete bands 100 – 400+ narrow, contiguous bands Spectral Resolution Low (e.g., 70-400 nm bandwidth) Very High (e.g., 5-10 nm bandwidth) Data Delivered A single data value for a wide range of wavelengths per band. A near-continuous spectral signature for each pixel. Data Volume & Cost Lower data volume, more cost-effective Very high data volume, complex processing, more expensive Common Platforms Satellites (Landsat, Sentinel, Planet), drones Specialized airborne sensors, drones, lab equipment Primary Strength Broad classification and monitoring Detailed identification and quantification of materials   Diving Deeper: What Are Spectral Signatures? The true power of hyperspectral imagery lies in its ability to detect detailed spectral signatures. Every material on Earth—a leaf, a mineral, a type of asphalt—absorbs and reflects light in a unique way across the electromagnetic spectrum. This unique pattern is its spectral signature, like a chemical fingerprint. (Image Suggestion: A graph showing the spectral signatures of healthy vegetation, dry soil, and water. Highlight how they have distinct absorption and reflectance patterns.) Alt Text: Graph showing the unique spectral reflectance signatures of vegetation, soil, and water. Multispectral can see general shapes of these signatures. It can tell you that a pixel is “probably vegetation” because it has high reflectance in the Near-Infrared (NIR) band. Hyperspectral sees the exact shape of the signature. It can tell you the vegetation is a corn plant suffering from nitrogen deficiency because it detects subtle absorption features in the red-edge spectrum that are invisible to multispectral sensors. Read Also: ArcGIS Pro vs. QGIS: The Ultimate 2025 Showdown (Pros, Cons & Verdict) What is a TIN (Triangulated Irregular Network)? How to Use QGIS for Precision Farming: A Beginner’s Guide [2025] When to Use Which? A Practical Application Guide Use Multispectral Imagery For: Land Cover Classification: Mapping broad categories like urban, forest, agriculture, and water. Vegetation Health (NDVI): Using indices like NDVI to monitor large-scale crop health or forest stress. Change Detection: Monitoring urban sprawl, deforestation, or glacier retreat over time. Water Body Mapping: Delineating lakes, rivers, and coastlines. Multispectral is your reliable, cost-effective workhorse for large-area studies and routine monitoring. Use Hyperspectral Imagery For: Mineral Exploration & Geology: Identifying specific mineralogy (e.g., clays, carbonates, ore minerals) based on their precise spectral fingerprints. This is one of its most powerful applications. Precision Agriculture: Differentiating between crop types and detecting specific nutrient deficiencies, water stress, or disease outbreaks before they are visible to the eye or to multispectral sensors. Environmental Monitoring: Detecting and quantifying specific pollutants in soil or water, such as oil spills or chemical plumes. Defense & Intelligence: Identifying camouflaged objects or classifying specific man-made materials. Hyperspectral is your specialist tool for when you need to know the specific “what,” not just the general “where.” The Trade-Offs: It’s Not All Black and White Choosing between MSI and HSI involves balancing several factors: Cost & Accessibility: Multispectral data is widely available from free satellite sources (Landsat, Sentinel) and affordable drones. Hyperspectral data collection is significantly more expensive and requires specialized, often airborne, sensors. Data Volume & Processing: A single hyperspectral flight can generate terabytes of data, requiring sophisticated software and powerful computing resources for processing and analysis. Multispectral data is far more manageable. The “Curse of Dimensionality”: With hundreds of bands, hyperspectral data can lead to analysis challenges where the sheer volume of information makes it difficult to extract meaningful patterns without advanced statistical techniques. Conclusion: Multispectral vs. Hyperspectral Imagery The choice between multispectral and hyperspectral imagery isn’t about one being “better” than the other. It’s about selecting the right tool for your specific question, budget, and scale. Start with Multispectral. If you need to answer broad “what and where” questions over large areas, multispectral imagery is almost always the most practical and cost-effective starting point. Upgrade to Hyperspectral. When your project demands detailed, material-specific answers—like identifying a particular mineral or diagnosing a specific plant disease—the investment in hyperspectral imagery becomes not just useful, but essential. As processing power increases and costs decrease, the line between these technologies will continue to blur. But for now, understanding their fundamental differences empowers you to see our world with the right kind of vision. FAQ: Multispectral vs. Hyperspectral Imagery Q: Can you get hyperspectral data from satellites? A: Yes, but it’s less common. Dedicated hyperspectral satellites like NASA’s EMIT and ESA’s PRISMA are operational, but the data is not as ubiquitous as multispectral data from Landsat or Sentinel. Q: Is hyperspectral imagery just higher resolution multispectral? A: No. This is a common misconception. The difference is spectral resolution (number and narrowness of bands), not spatial resolution (pixel size). You can have high-spatial-resolution multispectral data and low-spatial-resolution hyperspectral data. Q: What software is used to analyze hyperspectral data? A: It requires specialized software like ENVI, which has robust tools for handling and analyzing large hyperspectral cubes, alongside open-source options in Python (e.g., scikit-learn, Spectral Python). Q: For precision agriculture, is hyperspectral always better? A: Not always. Multispectral is often sufficient for general … Read more

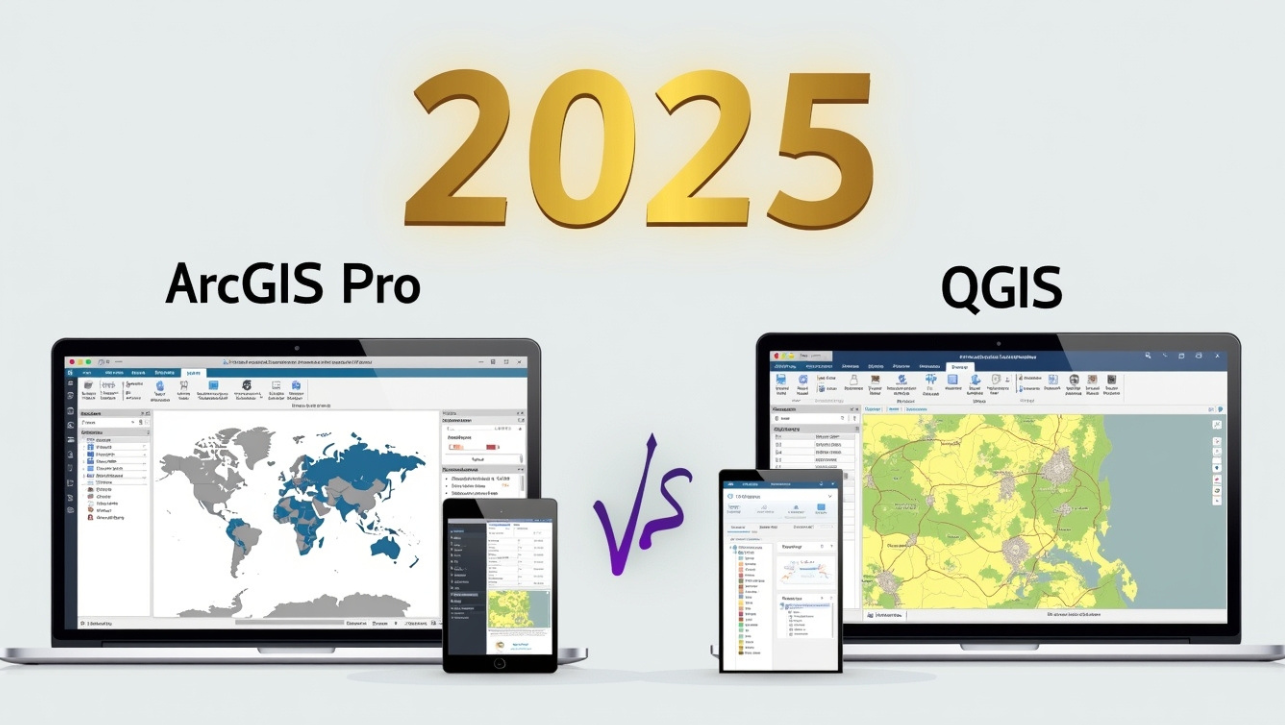
ArcGIS Pro vs. QGIS: The Ultimate 2025 Showdown (Pros, Cons & Verdict)

ArcGIS pro vs. Qgis

If you’re stepping into the world of Geographic Information Systems (GIS), one question inevitably arises: Should I use ArcGIS Pro or QGIS? This isn’t just a choice of software; it’s a choice of ecosystem, philosophy, and budget. On one side, you have ArcGIS Pro, the powerful, industry-standard suite from Esri, known for its seamless integration and enterprise strength. On the other, you have QGIS, the robust, open-source champion that is both free and incredibly powerful. This isn’t about declaring one the “winner.” It’s about answering a more important question: Which GIS software is right for YOU? Let’s break down this great GIS debate. ArcGIS Pro vs. QGIS at a Glance Feature ArcGIS Pro QGIS Cost Commercial License ($$$) Free & Open-Source ( $0 ) Learning Curve Steeper, structured Gentler, more flexible Ecosystem & Integration Excellent (ArcGIS Online, Enterprise) Good (relies on plugins & external data) Core Functionality Very Strong Very Strong Advanced & Niche Tools Included (e.g., 3D, Spatial Analytics) Available via Plugins Customization & Scripting Python (ArcPy), ArcGIS API for Python Python (PyQGIS), R, C++ Best For Large Enterprises, Government, Seamless Workflows Students, Consultants, Researchers, Budget-Conscious Users   The Deep Dive: Breaking Down the Key Factors 1. Cost: The Biggest Differentiator QGIS: This is the most significant advantage. QGIS is completely free. You can download, install, and use it for any purpose—personal, academic, or commercial—without ever paying a cent. There are no hidden fees or subscription tiers. ArcGIS Pro: Operates on a proprietary licensing model. It’s typically sold as part of an Esri ArcGIS Online subscription. Costs can range from $500 to $2,000+ per user, per year, depending on the license level and organizational agreement. While expensive for individuals, this cost often includes access to the entire ArcGIS ecosystem (Online, Living Atlas, etc.). Verdict: If budget is your primary concern, QGIS is the undisputed champion. 2. User Interface & Learning Curve QGIS: Known for its logical, if sometimes slightly dated, interface. It’s highly customizable, allowing you to arrange toolbars to your liking. The learning curve is considered gentler for beginners because you can immediately start using powerful tools without a financial commitment. The menus are straightforward, making it easier to discover functionality. ArcGIS Pro: Features a modern, ribbon-based interface (similar to Microsoft Office). It’s sleek and well-organized but can feel overwhelming initially. The learning curve is steeper, not just because of the interface, but because it’s part of a vast ecosystem. Understanding how Pro connects to Portal and ArcGIS Online is part of the process. Verdict: QGIS is easier to pick up. ArcGIS Pro has a more modern UI but a steeper learning curve due to its extensive ecosystem. 3. Core Functionality & Advanced Tools For 90% of common GIS tasks—digitizing, basic spatial analysis, geoprocessing, and map production—both platforms are exceptionally capable. ArcGIS Pro: Where it pulls ahead is in integrated advanced capabilities. Tools for 3D analytics (ArcGIS Scene), deep machine learning, real-time data processing, and sophisticated spatial statistics (Spatial Analyst extension) are built directly into the platform and work seamlessly together. QGIS: Its power is modular. Through its incredible plugin ecosystem (via the Official QGIS Repository and third-party sources), you can add almost any functionality imaginable. Plugins like Processing NextGen (for model building), Semi-Automatic Classification Plugin (for remote sensing), and MMQGIS (for geocoding) make it a powerhouse. However, you are responsible for finding, installing, and maintaining these plugins. Verdict: For out-of-the-box, seamless advanced analytics, ArcGIS Pro leads. For customizable power through plugins, QGIS is incredible. Read Also: How to Use QGIS for Precision Farming: A Beginner’s Guide [2025] How to Create an Unsupervised Classification Map in ENVI: Complete Step-by-Step Guide 2025 Land Suitability Analysis for Agriculture Using GIS: Methods & Case Studies [2025] 4. Data Ecosystem & Integration ArcGIS Pro: This is Esri’s “walled garden,” and it’s a beautiful one. It integrates flawlessly with ArcGIS Online and ArcGIS Enterprise. This gives you instant access to Living Atlas of the World (a massive collection of authoritative maps and data), easy web map publishing, and powerful collaboration tools across an organization. It’s the complete package. QGIS: It is a “gateway” to the open-source geospatial world. It connects effortlessly to countless data sources (WMS, WFS, PostGIS databases, etc.). However, it doesn’t come with a pre-packaged data library. You are the curator of your own data universe. Verdict: ArcGIS Pro offers a seamless, integrated ecosystem. QGIS offers unparalleled flexibility in a multi-source world. 5. Support & Community QGIS: Relies on community support. This includes official documentation, Stack Exchange, and user forums. The community is vast, passionate, and incredibly helpful. However, there is no official phone number to call for help. ArcGIS Pro: Comes with official, paid support from Esri. This includes technical support, extensive training modules (Esri Academy), and a vast knowledge base. For large organizations, this enterprise-level support is non-negotiable. Verdict: Need guaranteed, professional support? Choose ArcGIS Pro. Prefer a passionate, global community? QGIS has you covered. Who Should Choose Which? A Clear Guide Choose ArcGIS Pro if: You work in a large organization (government, corporation) that already uses the Esri ecosystem. Your workflow heavily relies on ArcGIS Online/Enterprise for sharing and collaboration. You need seamless, out-of-the-box advanced analytics and 3D capabilities. Your projects require official technical support and guaranteed uptime. Budget is not the primary constraint. Choose QGIS if: You are a student, hobbyist, consultant, or researcher on a budget. You value open-source philosophy and want to avoid vendor lock-in. You enjoy tinkering, customizing, and building your perfect GIS toolkit with plugins. Your work involves connecting to a wide variety of open data standards and databases. You are just starting your GIS journey and want to learn without a financial barrier. The Final Verdict: It’s Not a War, It’s a Toolkit The truth is, many professional GIS users don’t choose one exclusively. They use both. A common workflow is to use QGIS for quick data inspection, cleaning, and for accessing specialized open-source tools, and then use ArcGIS Pro for enterprise-level sharing, advanced Esri-specific analytics, and web map publishing. Still unsure? Here’s the simplest way to decide: Download QGIS first. It’s free. Spend a month with it. Complete a project. You will learn the fundamental concepts of GIS without any cost. If you then find yourself needing the integrated ecosystem, collaborative features, or specific advanced tools that only Esri provides, then you can confidently make the business case for investing in ArcGIS Pro. Ultimately, the “right” software is … Read more