Top 15 Map Maker Interview Questions & Answers

Map Maker

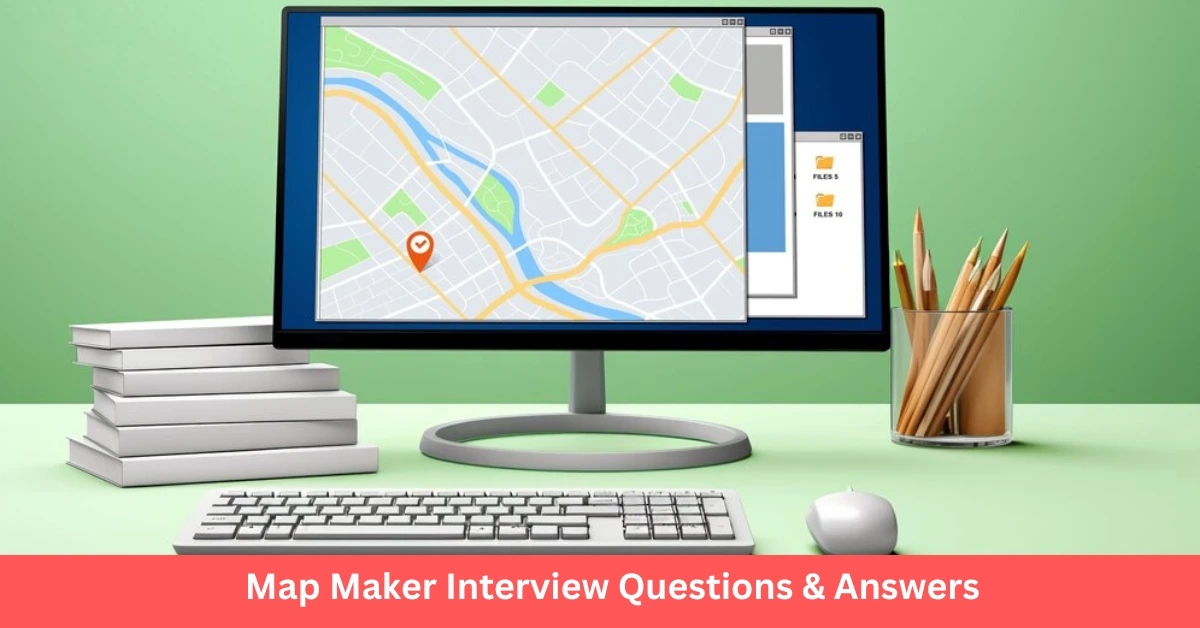
Map-making, or cartography, is an essential skill in geospatial science, enabling the visualization of geographic data for various applications. As a Map Maker, you need to demonstrate technical expertise in GIS software, spatial data, and map design principles. Here are the top 15 map maker interview questions and answers to help you prepare effectively. 15 Map Maker Interview Questions & Answers Here’s a comprehensive list of 15 Map Maker Interview Questions & Answers along with detailed answers to help you prepare and impress your interviewers. 1. What is the role of a map maker? Answer: A map maker, or cartographer, designs maps by interpreting and visualizing spatial data. Their role involves analyzing geographic data, ensuring accuracy, and creating maps for applications like urban planning, navigation, and environmental studies. 2. What tools and software do you use for creating maps? Answer: I use: GIS software: ArcGIS, QGIS. Remote sensing tools: ERDAS IMAGINE, ENVI. Design tools: Adobe Illustrator, CorelDRAW for cartographic design. Mapping platforms: Google Maps API, Mapbox. 3. How do you ensure the accuracy of your maps? Answer: Accuracy is ensured through: Validating data with GPS or field surveys. Using reliable data sources like government agencies or satellite providers. Regularly updating maps to reflect real-world changes. Related Article: Top 15 Field Map Editor Interview Questions & Answers 4. What is the difference between a topographic and a thematic map? Answer: Topographic maps depict physical features like elevation, terrain, and water bodies. Thematic maps focus on specific themes, such as population density or climate patterns. 5. What are map projections, and why are they important? Answer: Map projections are methods of representing the Earth’s 3D surface on a 2D plane. They are crucial because they affect the accuracy of distance, shape, area, and direction on maps. Common projections include Mercator, Lambert Conformal Conic, and Robinson. Related Article: Top 15 Mapper Interview Questions & Answers 6. How do you handle large datasets when creating maps? Answer: I manage large datasets by: Filtering and preprocessing data to reduce size. Using cloud-based GIS platforms like Google Earth Engine. Employing geodatabases like PostgreSQL with PostGIS. 7. What is your experience with spatial data formats? Answer: I am proficient in: Vector formats: Shapefiles, GeoJSON, KML. Raster formats: TIFF, JPEG, PNG. Database formats: SQL, GeoPackage. Related Article: Top 15 LIDAR Technician Interview Questions & Answers 8. How do you design user-friendly and visually appealing maps? Answer: I follow cartographic principles such as: Using appropriate colors and symbols. Maintaining a clear legend and scale. Avoiding clutter and focusing on the map’s purpose. 9. Can you explain the concept of scale in map-making? Answer: Scale represents the relationship between map distance and real-world distance. It is expressed as a ratio (e.g., 1:50,000). Larger scales show more detail, while smaller scales cover broader areas. Related Article: Top 15 Cartography Technician Interview Questions and Answers 10. What is georeferencing, and why is it important? Answer: Georeferencing aligns spatial data to a coordinate system, enabling accurate representation on maps. It’s essential for integrating various datasets and ensuring spatial accuracy. 11. What challenges have you faced in map-making projects, and how did you overcome them? Answer: Challenges include inconsistent data formats and missing information. I overcame these by: Applying data cleaning techniques. Collaborating with data providers for accurate inputs. Using interpolation to estimate missing values. 12. What is the difference between GIS and cartography? Answer: GIS involves collecting, analyzing, and managing spatial data. Cartography focuses on visualizing this data effectively through map design. Related Article: Top 15 Cadastral Mapper Interview Questions 13. How do you stay updated with advancements in map-making? Answer: I keep up by: Attending geospatial conferences and webinars. Following industry blogs and journals. Learning new tools and techniques through online courses. 14. What is the importance of metadata in map-making? Answer: Metadata provides essential details about the data source, accuracy, date, and coordinate system. It ensures transparency and helps users understand the reliability of the map. Related Article: 15 Cartographic Designer Interview Questions 15. Can you describe a successful map-making project you worked on? Answer: In one project, I developed a land-use map for urban planning using satellite imagery and GIS tools. The map guided zoning decisions and optimized resource allocation for the city. Conclusion Map makers are essential in bridging the gap between complex spatial data and actionable insights. By preparing these top 15 Map Maker Interview questions and answers, you can showcase your technical skills and creative approach to designing maps. Stay tuned to our blog for more resources to boost your geospatial career!

Top 15 Cartography Technician Interview Questions and Answers

Cartography Technician

A Cartography Technician plays a crucial role in the field of geospatial analysis and mapping. They are responsible for creating, editing, and analyzing maps that serve various industries, including urban planning, environmental studies, transportation, and more. To secure a position as a Cartography Technician, you need to be well-prepared for the interview. This blog post will guide you through 15 common interview questions for Cartography Technicians, along with detailed answers to help you stand out and showcase your expertise. 15 Cartography Technician Interview Questions and Answers 1. What are the key responsibilities of a Cartography Technician? Answer: The main responsibilities of a Cartography Technician include data collection, map creation, and editing. They work with GIS software, digitize geographical information, ensure data accuracy, and create visual representations of spatial data. They may also assist in updating and maintaining geospatial databases and collaborate with other departments for specific mapping projects. 2. Which GIS software tools are you proficient in, and how have you used them in past projects? Answer: I am proficient in using GIS software tools such as ArcGIS, QGIS, and AutoCAD Map 3D. For example, in my previous role, I used ArcGIS for digitizing land parcels and creating thematic maps. I utilized QGIS for data analysis due to its open-source plugins, and AutoCAD Map 3D helped in integrating CAD data with geospatial data for infrastructure projects. 3. Can you explain the difference between vector and raster data, and when you would use each? Answer: Vector data represents geographic features using points, lines, and polygons, making it suitable for precise data like property boundaries or roads. Raster data consists of pixels or cells, often used for continuous data like satellite imagery or elevation models. I use vector data when mapping discrete features and raster data for analyzing spatial phenomena like temperature variations. 4. How do you ensure the accuracy of the data used in map creation? Answer: To ensure data accuracy, I cross-reference multiple data sources, verify against ground-truth data, and use quality control measures like topology checks in GIS software. I also review metadata to assess the source and date of the data, ensuring it is up-to-date and reliable. 5. Describe a challenging project you worked on and how you handled it. Answer: In one project, I was tasked with updating a city’s zoning map, but the existing data was outdated and inconsistent. I conducted a data audit, identified discrepancies, and collaborated with the local planning department for updated information. Through careful data integration and verification, I successfully completed the project with accurate and reliable outputs. Read Also: 15 Cartographic Drafter Interview Questions and Answers 6. What steps do you take to design a map that is both accurate and visually appealing? Answer: I start by understanding the map’s purpose and target audience. I ensure accuracy by using verified data sources and applying appropriate symbology. For visual appeal, I focus on clear color schemes, intuitive legends, and balanced labeling. I also adhere to cartographic principles like scale, hierarchy, and alignment to enhance the map’s readability. 7. How do you decide on the appropriate map projection for a given project? Answer: Choosing a map projection depends on the map’s purpose and the area being represented. For example, I use UTM for small areas requiring high precision, while Albers Equal Area is suitable for thematic maps of larger regions. I consider factors like distortion, area, and shape to ensure the projection is appropriate for the project’s needs. Read Also: 15 Cartographic Designer Interview Questions 8. What techniques do you use to integrate data from multiple sources? Answer: I use GIS tools like georeferencing and spatial joins to align data from different sources. I also standardize data formats and attributes to ensure consistency. When integrating diverse datasets, I perform a thorough quality check to identify and resolve any discrepancies. 9. Can you explain the importance of scale in cartography? Answer: Scale is crucial in cartography because it dictates the level of detail and the map’s usability. A larger scale (e.g., 1:10,000) provides more detail and is used for local maps, while a smaller scale (e.g., 1:1,000,000) is suitable for regional or global maps with generalized features. Choosing the right scale helps convey the correct information without overwhelming the viewer. Read Also: Top 17 Cartographer Interview Questions 10. How do you handle labeling in areas of a map where features are densely packed? Answer: In densely packed areas, I use dynamic labeling tools in GIS software to prevent overlap and clutter. I may also apply abbreviations or use leader lines to ensure all labels are readable. Additionally, I prioritize important features and adjust the font size and style for clarity. 11. What is your experience with creating thematic maps? Answer: I have extensive experience creating thematic maps for various projects, such as population density and land use analysis. I use classification techniques like natural breaks or equal intervals to represent data accurately. I also select color schemes that are intuitive and easy to interpret, enhancing the map’s effectiveness. 12. How do you ensure that your map designs are accessible to users with visual impairments? Answer: I use high-contrast color schemes and avoid using color combinations that are problematic for color-blind users (e.g., red-green). I also include texture patterns and clear symbology to differentiate features without relying solely on color. Adding descriptive labels and legends helps make the map more accessible. Read Also: 15 Must-Ask Interview Questions for Cartographer 13. Describe a time when you received client feedback that required major changes to a map. How did you handle it? Answer: In a previous project, a client requested changes to the color scheme and symbology to align with their branding guidelines. I reviewed the feedback, made the necessary adjustments, and presented a revised version that met their expectations while maintaining the map’s clarity and accuracy. I maintained open communication throughout the process to ensure client satisfaction. 14. What are some common cartographic errors you have seen, and how do you avoid them? Answer: Common … Read more

15 Cartographic Drafter Interview Questions and Answers

Cartographic Drafter Interview Questions

Navigating a career as a Cartographic Drafter requires a blend of artistic creativity, technical precision, and a deep understanding of spatial data. Whether you’re just starting out or have years of experience, preparing for an interview is key to standing out in this competitive field. This guide features 15 essential Cartographic Drafter interview questions and answers to help you showcase your skills, highlight your experience, and impress potential employers. From data integration to map design principles, these questions cover the core areas you need to master. Let’s dive in and get you ready to excel in your next interview! 15 Essential Cartographic Drafter Interview Questions and Answers Here’s a comprehensive list of 15 Cartographic Drafter interview questions along with detailed answers to help you prepare and impress your interviewers. 1. What is your experience with map drafting and design software? Answer: I have extensive experience using industry-standard software like ArcGIS, QGIS, AutoCAD Map 3D, and Adobe Illustrator for cartographic drafting. I’m proficient in tools such as the Layout View in ArcGIS for map composition and have a strong command of symbology, labeling, and data visualization. Additionally, I often use Illustrator to fine-tune map aesthetics and ensure professional-quality outputs. 2. How do you handle working with outdated or incomplete data? Answer: When faced with outdated or incomplete data, I begin by conducting a thorough data quality assessment to determine what information is missing. I often use supplementary datasets from reliable sources or consult with subject matter experts to fill the gaps. If the data discrepancy cannot be resolved, I document it clearly and communicate the limitations of the map to stakeholders. 3. Can you explain the difference between large-scale and small-scale maps? Answer: Large-scale maps show a smaller area with a high level of detail (e.g., 1:10,000), suitable for city maps or site plans. Small-scale maps cover a larger area with less detail (e.g., 1:1,000,000), often used for regional or world maps. In cartographic drafting, choosing the right scale is crucial for ensuring that the map accurately conveys the necessary information. 4. Describe your process for ensuring data accuracy in your maps. Answer: I follow a multi-step quality control process that includes data verification, cross-referencing with authoritative sources, and conducting topology checks to identify and correct errors like overlapping polygons or gaps. I also run spatial analyses and peer reviews to confirm that the data accurately represents the real-world features. 5. What is the importance of map projections, and how do you choose one? Answer: Map projections are crucial because they affect how the Earth’s curved surface is represented on a flat map. I choose a projection based on the purpose of the map and the geographical area being represented. For example, I might use the Mercator projection for navigational maps due to its accurate angle representation, or the Albers Equal-Area projection for thematic maps that require accurate area depiction. Related Articles:  Top 17 Cartographer Interview Questions 15 Must-Ask Interview Questions for Cartographer 15 Cartographic Designer Interview Questions 6. How do you simplify complex data for a non-technical audience? Answer: I focus on using clear visual hierarchies, simplified symbology, and minimal jargon. I use legends and annotations to explain complex elements and employ techniques like color coding and graphical representations (e.g., pie charts or heat maps) to make the data more accessible and easy to understand. 7. Describe a challenging project where you had to integrate multiple data sources. Answer: In a recent project, I had to create a regional land use map using datasets from different sources, including satellite imagery, field surveys, and local government records. I began by standardizing the datasets, resolving discrepancies in data formats, and aligning coordinate systems. Through careful data integration and consistency checks, I was able to produce a cohesive and accurate map. 8. How do you choose colors and symbols for your maps? Answer: I use color schemes that align with the map’s purpose and consider color accessibility (e.g., color-blind friendly palettes). I follow cartographic design principles, choosing symbols that are intuitive and easily distinguishable. For thematic maps, I use graduated colors to represent data variations effectively, ensuring that the colors are harmonious and enhance readability. 9. Can you explain your approach to map labeling? Answer: I follow the principles of readability and hierarchy. I prioritize the most important features for larger, bolder labels and use smaller fonts for secondary information. I ensure that labels are placed without obscuring map features, using techniques like curved text for rivers and adjusting label placement dynamically for densely packed areas. 10. What strategies do you use to avoid common cartographic errors? Answer: I implement a robust quality assurance process, which includes topology checks, visual inspections, and peer reviews. I also regularly validate the data sources I use, ensuring that any outdated or inconsistent data is flagged. Additionally, I keep up with best practices in cartography to avoid common pitfalls like distortion from improper projections or inconsistent symbology. 11. How do you handle feedback or revisions from clients? Answer: I view client feedback as an opportunity to refine the map and ensure it meets their needs. I maintain an open line of communication, asking for clarification if needed and providing professional advice when their requests might affect the map’s accuracy or clarity. I prioritize the revisions based on client feedback while adhering to cartographic standards. 12. What is your experience with designing thematic maps? Answer: I have extensive experience designing thematic maps, including choropleth maps, heat maps, and dot density maps. I focus on using effective color schemes and data classification methods, such as natural breaks or equal intervals, to accurately represent the data. My goal is to ensure that the thematic map is both visually appealing and informative. 13. How do you ensure your maps are accessible to all users, including those with visual impairments? Answer: I use color-blind friendly palettes and ensure that all map elements have sufficient contrast. Additionally, I include text labels and avoid relying solely on color to convey information. When designing … Read more

15 Cartographic Designer Interview Questions

Cartographic Designer Interview

Are you preparing for a Cartographic Designer interview? As the demand for skilled cartographers grows, companies are looking for candidates who not only excel in cartographic principles but also have the creativity to produce visually appealing and accurate maps. In this blog post, we’ve compiled a list of the 15 must-ask interview questions for Cartographic Designers, complete with insights on what interviewers are seeking. Whether you’re an aspiring cartographer or a seasoned designer looking to brush up, these questions will help you showcase your skills and ace your next interview. 15 Cartographic Designer Interview Questions and Answer 1. What is your approach to designing a map for a non-technical audience? How do you simplify complex data? Answer: When designing a map for a non-technical audience, my primary goal is to create a visual that is both informative and easy to understand. Here’s my approach to simplifying complex data for such audiences: Understand the Audience and Purpose: First, I identify the key purpose of the map and the needs of the target audience. For a non-technical audience, it’s crucial to focus on clarity rather than including every detail. I consider what information is most relevant to them and tailor the map accordingly. Simplify the Data Layers: I limit the number of data layers to avoid overwhelming the viewer. By focusing on the most essential information, I can make the map easier to read. Complex datasets are often aggregated or summarized to highlight major trends or patterns rather than individual data points. Use Intuitive Symbology and Colors: I select symbols and colors that are intuitive and easily recognizable. For example, using blue for water bodies, green for parks, and red for warnings or important areas. I avoid using overly technical icons and ensure that the legend clearly explains what each symbol represents. Clear and Minimal Text: I use simple, straightforward language for labels, legends, and titles. Avoiding jargon is key to making the map accessible. When necessary, I include brief annotations or explanations to guide the viewer and provide context. Interactive Elements (if applicable): For digital maps, I incorporate interactive features such as tooltips or pop-up information boxes. This allows users to explore the data at their own pace without being overwhelmed by all the information at once. These elements provide extra details without cluttering the main view. Testing and Feedback: I often present the initial design to a small sample of non-technical users to gather feedback. This helps me identify any areas of confusion and make adjustments before the final version. I pay close attention to their questions and challenges, using this input to simplify the design further. Consistency and Visual Hierarchy: I maintain consistency in design elements and establish a clear visual hierarchy. Important information is highlighted using larger icons, bold colors, or prominent placement, while less critical data is subdued. This approach guides the viewer’s eye and helps them quickly grasp the main points. Example: For a recent project, I created a public-facing map to show areas affected by road construction. Instead of displaying complex traffic patterns, I simplified the map by highlighting only the closed roads and alternate routes using distinct colors and clear labels. This approach made the map easy to understand, even for users with no prior map-reading experience. 2. Can you explain the principles of cartographic design that you follow when creating a map layout? Answer: Cartographic design is both an art and a science, requiring a careful balance between aesthetic appeal and accurate data representation. When creating a map layout, I follow several key principles to ensure that the final product is not only visually appealing but also effective in communicating information clearly. Here are the main principles I follow: Clarity and Simplicity: The primary goal of any map is to convey information clearly. I avoid clutter by limiting the number of layers and elements, only including what is necessary for the map’s purpose. Simplifying the content helps prevent information overload and ensures that users can easily interpret the map. Visual Hierarchy: Establishing a clear visual hierarchy helps direct the viewer’s attention to the most important elements of the map. I achieve this by using size, color, contrast, and placement to distinguish between primary features (e.g., main roads, landmarks) and secondary features (e.g., minor streets, background elements). Bold colors and larger symbols are used for prominent features, while less important details are subdued. Balance and Layout: I carefully plan the layout of the map, ensuring that elements are evenly distributed and balanced. The map frame, legend, scale bar, north arrow, and other components are placed in a way that does not distract from the main map content. White space is also strategically used to give the map a clean and organized appearance, reducing visual clutter. Consistency: Consistency is crucial in map design. I use uniform symbols, line styles, and color schemes throughout the map to avoid confusion. For example, water bodies are consistently shown in shades of blue, while transportation networks may use standardized colors like black for roads and gray for railways. This uniformity helps users quickly interpret the map features. Legibility: Text and labels should be easy to read, even at smaller sizes. I use clear, sans-serif fonts and ensure that labels do not overlap with map features. When necessary, I apply callouts or halos around text to enhance legibility. Labels are placed in logical locations that follow cartographic conventions, such as placing city names near their respective points or following the curve of a river. Color Theory and Symbology: I apply principles of color theory to select a harmonious color palette that enhances the map’s readability. Colors are chosen based on their contrast and relationship to one another, ensuring they are distinct yet complementary. For thematic maps, I use appropriate color schemes (e.g., sequential for gradient data, categorical for distinct classes) to represent different types of data effectively. Data Accuracy and Representation: Accuracy is fundamental in cartography. I verify that the spatial data used is up-to-date and reliable, avoiding the … Read more

Advanced Spatial Analysis Techniques for GIS Code

Advanced Spatial Analysis Techniques

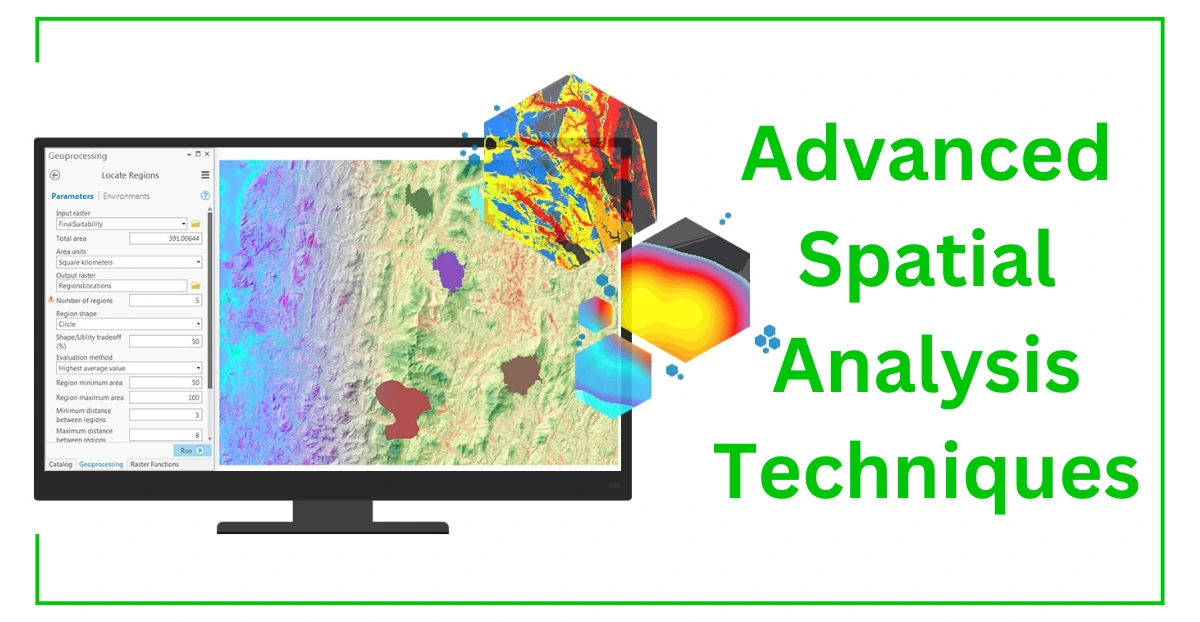
Spatial analysis has become a vital tool across various industries, transforming the way we visualize, interpret, and make decisions based on geospatial data. For GIS professionals, mastering advanced spatial analysis techniques for GIS code can open doors to deeper insights and enhanced predictive capabilities. This blog will walk you through the top advanced spatial analysis techniques, demonstrate how they are implemented using code, and explore best practices for integrating these methods into your GIS projects. 5 Advanced Spatial Analysis Techniques for GIS Code 1. Spatial Interpolation: Kriging Spatial interpolation predicts unknown values at specific locations based on known sample points. One of the most advanced methods for this is Kriging, which considers spatial autocorrelation in the data. Example (Python Code with GeoPandas and PyKrige): import numpy as np import geopandas as gpd from pykrige.ok import OrdinaryKriging # Load geospatial data data = gpd.read_file(‘sample_points.shp’) # Define coordinates and values x = data[‘longitude’].values y = data[‘latitude’].values z = data[‘elevation’].values # Perform Ordinary Kriging OK = OrdinaryKriging(x, y, z, variogram_model=’linear’, verbose=False, enable_plotting=False) z_pred, ss = OK.execute(‘grid’, np.linspace(min(x), max(x)), np.linspace(min(y), max(y))) # Output the results print(“Kriging Predicted Values:”, z_pred) Use Case: Kriging is commonly used in environmental monitoring, such as predicting soil properties or air quality across a region. 2. Hot Spot Analysis: Getis-Ord Gi Statistic* Hot spot analysis identifies statistically significant clusters of high or low values within your data. The Getis-Ord Gi* statistic is a powerful technique for this type of analysis. Example (Python Code with PySAL): import pysal import numpy as np import geopandas as gpd # Load geospatial data gdf = gpd.read_file(‘crime_data.shp’) # Calculate spatial weights w = pysal.lib.weights.Queen.from_dataframe(gdf) # Run Getis-Ord Gi* statistic g_star = pysal.explore.esda.getisord.G_Local(gdf[‘crime_rate’], w) # Add results to the DataFrame gdf[‘hot_spot’] = g_star.Zs # Output the results print(“Hot Spot Analysis Completed:”, gdf[[‘geometry’, ‘hot_spot’]]) Use Case: Hot spot analysis is often used in crime mapping to identify areas with high crime rates, helping law enforcement agencies allocate resources effectively. Related Articles Advanced Spatial Analysis Techniques 3. Network Analysis for Route Optimization Network analysis involves studying the connectivity and flow within a network, like road systems or utility networks. One advanced technique is using Dijkstra’s algorithm to find the shortest path between two points. Example (Python Code with NetworkX): import networkx as nx # Create a directed graph G = nx.read_shp(‘road_network.shp’) # Define start and end nodes start_node = (x_start, y_start) end_node = (x_end, y_end) # Find the shortest path using Dijkstra’s algorithm shortest_path = nx.shortest_path(G, source=start_node, target=end_node, weight=’length’) # Output the results print(“Shortest Path Found:”, shortest_path) Use Case: Network analysis is essential in transportation planning and logistics to determine optimal delivery routes and reduce travel times. 4. Spatial Regression for Predictive Modeling Spatial regression helps in understanding the relationship between a dependent variable and one or more independent variables while considering spatial dependencies. Geographically Weighted Regression (GWR) is a powerful technique in this category. Example (Python Code with mgwr): import geopandas as gpd from mgwr.gwr import GWR from mgwr.sel_bw import Sel_BW # Load geospatial data data = gpd.read_file(‘housing_data.shp’) # Prepare variables for GWR X = data[[‘income’, ‘population’]].values y = data[‘house_price’].values coords = list(zip(data[‘longitude’], data[‘latitude’])) # Select bandwidth bandwidth = Sel_BW(coords, y, X).search() # Fit the GWR model gwr_model = GWR(coords, y, X, bandwidth).fit() # Output model summary print(gwr_model.summary()) Use Case: Spatial regression is used in real estate analysis to predict housing prices based on socioeconomic factors and their spatial distribution. 5. Viewshed Analysis for Line-of-Sight Modeling Viewshed analysis determines the visible area from a specific point, considering the terrain. It is widely used in planning, such as determining the optimal location for a watchtower or telecommunications mast. Example (Python Code with Rasterio and NumPy): import rasterio import numpy as np # Load digital elevation model (DEM) with rasterio.open(‘dem.tif’) as src: dem = src.read(1) transform = src.transform # Define observer height and coordinates observer_height = 10 observer_coords = (x_observer, y_observer) # Perform viewshed analysis (simplified) viewshed = np.where(dem > observer_height, 1, 0) # Output the viewshed result print(“Viewshed Analysis Completed:”, viewshed) Use Case: Viewshed analysis is critical in urban planning and military operations for evaluating visibility and line-of-sight scenarios. Bonus Tips for Implementing Advanced Spatial Analysis Techniques Choose the Right Tool: Select software and libraries based on the specific analysis required. ArcGIS, QGIS, Python (GeoPandas, PySAL), and R are popular choices for different tasks. Data Quality Matters: Ensure your data is accurate, cleaned, and pre-processed before performing any advanced analysis to avoid misleading results. Stay Updated: Keep learning new techniques and tools as GIS technology is constantly evolving, and new methods are frequently introduced. Conclusion Mastering advanced spatial analysis techniques for GIS code can significantly enhance your ability to derive meaningful insights from geospatial data. Whether you’re dealing with predictive modeling, network analysis, or interpolation, these techniques can help you tackle complex projects and make informed decisions. Start incorporating these methods into your GIS workflow, and watch your analysis skills soar to the next level. FAQ: Advanced Spatial Analysis Techniques for GIS Code 1. Can I perform advanced spatial analysis using Python? Yes, Python offers several powerful libraries like GeoPandas, PySAL, and Rasterio for advanced spatial analysis. 2. What is the best software for advanced spatial analysis? ArcGIS, QGIS, and open-source Python libraries are the most commonly used tools for advanced spatial analysis. 3. How can I ensure data accuracy in spatial analysis? You can ensure data accuracy through data validation, using high-quality sources, and implementing robust quality control measures.

Advanced Spatial Analysis Techniques

Advanced Spatial Analysis Techniques

In today’s data-driven world, making informed decisions requires more than just raw data; it requires the ability to extract meaningful patterns and insights from spatial data. This is where advanced spatial analysis techniques come into play. Whether you’re a GIS analyst, data scientist, or researcher, understanding these techniques can transform the way you interpret geospatial data. In this blog post, we’ll dive deep into the most powerful advanced spatial analysis techniques that can help you uncover hidden trends, optimize processes, and solve complex problems. What is Spatial Analysis? Spatial analysis involves examining the locations, attributes, and relationships of features in spatial data using statistical and computational techniques. It helps answer questions like “Where are the hotspots?” or “What is the best location for a new facility?” When it comes to advanced spatial analysis techniques, the focus shifts from basic querying to more complex, predictive, and inferential analysis. Why Use Advanced Spatial Analysis Techniques? As the volume and complexity of geospatial data increase, so does the need for advanced techniques. These methods allow analysts to: Identify Patterns that are not obvious through simple visualization. Predict Future Trends based on historical data. Make Data-Driven Decisions by leveraging in-depth statistical analysis. Top Advanced Spatial Analysis Techniques 1. Hot Spot Analysis Hot spot analysis identifies statistically significant clusters of high or low values. This technique is widely used in crime mapping, public health, and retail analytics to pinpoint areas of concern or opportunity. Example: In public health, hot spot analysis can help identify areas with high incidence rates of a disease, allowing targeted interventions. 2. Spatial Autocorrelation Spatial autocorrelation measures the degree to which similar values occur close together in space. It helps determine if the observed spatial pattern is random or if there is a relationship between the data points. Example: In urban planning, spatial autocorrelation can reveal if property values are clustered due to certain factors like proximity to schools or parks. 3. Network Analysis Network analysis examines spatial networks, such as transportation or utility networks, to solve routing problems, optimize logistics, and analyze connectivity. Example: Logistics companies use network analysis to find the shortest delivery routes, reducing time and costs. 4. Interpolation Methods Interpolation estimates unknown values at unsampled locations based on nearby measured values. Common interpolation methods include Inverse Distance Weighting (IDW) and Kriging. Example: Interpolation is used in environmental studies to predict air pollution levels at locations where no direct measurements are available. 5. Multi-Criteria Decision Analysis (MCDA) MCDA involves evaluating multiple criteria to make complex decisions. It’s particularly useful in site selection and land-use planning. Example: MCDA can help determine the best location for a new hospital by analyzing factors like accessibility, population density, and environmental constraints. 6. Spatial Regression Spatial regression models account for spatial dependency in data, providing more accurate results than traditional regression analysis. Example: Spatial regression can be used in real estate to analyze the impact of location on property prices. 7. Geostatistics (Kriging) Kriging is a geostatistical method that provides the best linear unbiased prediction of spatially distributed data. It’s highly effective for mapping continuous variables. Example: Kriging is commonly used in geology and environmental sciences to create detailed maps of soil properties or pollutant concentrations. Practical Applications of Advanced Spatial Analysis Advanced spatial analysis techniques have numerous applications across various industries, including: Public Health: Identifying disease outbreak patterns. Urban Planning: Analyzing land use and infrastructure needs. Environmental Monitoring: Predicting climate change impacts. Retail and Marketing: Understanding customer demographics and optimizing store locations. Tools and Software for Spatial Analysis To effectively perform advanced spatial analysis, you need robust tools. Popular software includes: ArcGIS: Comprehensive GIS software with advanced spatial analysis capabilities. QGIS: Open-source GIS software ideal for complex analysis. Python with GeoPandas: For customized, script-based analysis. R with Spatial Packages: For statistical and geostatistical analysis. Challenges in Advanced Spatial Analysis and How to Overcome Them While advanced spatial analysis is powerful, it comes with challenges: Data Quality Issues: Incomplete or inaccurate data can lead to unreliable results. Use thorough data cleaning and validation processes. Computational Complexity: Advanced analysis techniques often require significant computational resources. Use efficient algorithms and leverage cloud-based solutions. Choosing the Right Technique: Each technique has its strengths and limitations. Understanding the problem context is key to selecting the most appropriate method. Conclusion Mastering advanced spatial analysis techniques is a game-changer for any GIS professional. By leveraging these powerful tools and methods, you can gain deeper insights, make better predictions, and drive data-driven decisions across various applications. Whether you’re tackling urban planning, environmental monitoring, or business analytics, these techniques will help you elevate your spatial analysis skills and deliver impactful results. FAQ: Advanced Spatial Analysis Techniques What are advanced spatial analysis techniques? Advanced spatial analysis techniques involve complex statistical and computational methods used to analyze, interpret, and predict patterns within geospatial data. These techniques go beyond basic spatial analysis and include methods like hot spot analysis, Kriging, and spatial regression. Why are advanced spatial analysis techniques important? These techniques help uncover hidden patterns, make accurate predictions, and inform data-driven decision-making across various industries like urban planning, environmental monitoring, and public health. What is the difference between basic and advanced spatial analysis? Basic spatial analysis focuses on simple spatial queries, measurements, and visualizations. Advanced spatial analysis involves more complex statistical methods and predictive modeling to gain deeper insights from geospatial data.

Top 17 Cartographer Interview Questions

Cartographer Interview Questions

When preparing for a cartographer interview, and search types of questions are asked for Cartographer Interview Questions, it’s essential to anticipate the kinds of questions that will test not only your technical skills but also your ability to solve problems and communicate complex information. As a cartographer, you’ll be expected to showcase your expertise in map design, spatial analysis, and understanding of geospatial data. But interviews for this role also delve into your creativity, collaboration with cross-functional teams, and problem-solving approaches. In this blog post, we’ve compiled Top 17 Cartographer Interview Questions that will help you prepare for your interview with confidence. These questions cover a wide range of topics, from technical GIS knowledge to how you approach real-world mapping challenges. Whether you’re an experienced professional or just starting your career in cartography, these questions will provide valuable insights into what hiring managers are looking for, and how to present yourself as the ideal candidate. Let’s dive in! 1. What steps have you taken at your current (or last) employer to create an inclusive work or learning environment? “At my last job, I took several steps to help foster an inclusive work environment. First, I actively encouraged open dialogue within the team, making sure everyone felt comfortable sharing their ideas and feedback. I believe that diverse perspectives are crucial in cartography, as different viewpoints can lead to more innovative solutions. Additionally, I initiated knowledge-sharing sessions where team members could showcase their unique skills, whether it was proficiency in a specific GIS tool or expertise in a certain type of mapping project. This helped create a culture of learning and mutual respect. I also made it a point to include team members from different departments in project meetings to gain varied insights and ensure that our work addressed the needs of all stakeholders. Lastly, I advocated for inclusive hiring practices, emphasizing the importance of considering candidates from diverse backgrounds, especially in roles related to geospatial analysis and cartography.” 2. How do you handle tight deadlines when working on a complex mapping project? When faced with tight deadlines on a complex mapping project, I follow a structured approach to ensure timely and quality delivery. First, I break the project into smaller, manageable tasks and prioritize them based on their importance and dependencies. This allows me to create a clear timeline and set realistic milestones. Next, I focus on efficient time management and avoid getting stuck in unnecessary details, especially during the initial phases. I use automated tools and scripts in GIS software like ArcGIS or QGIS whenever possible to speed up repetitive tasks, such as data cleaning and processing. Communication is also key—I make sure to keep all stakeholders informed about the progress and any potential challenges. If I anticipate a delay, I promptly notify the team and discuss possible solutions to stay on track. Finally, I stay flexible and adaptable. In case of unexpected issues, I am prepared to pivot and adjust the plan, focusing on the core requirements to meet the deadline while maintaining map quality and accuracy. 3. Can you explain how you approach communicating complex geospatial data to a non-technical audience? When communicating complex geospatial data to a non-technical audience, I focus on simplifying the information without losing its key message. My approach involves three main steps: Understand the Audience: I first assess the audience’s knowledge level and interests. This helps me tailor the presentation, choosing language and examples that are relatable. For example, if I’m presenting to city planners, I focus on how the data impacts urban development rather than technical details. Use Visuals and Simplified Maps: Geospatial data can be overwhelming in raw form, so I rely on clear and easy-to-read maps, infographics, and visual aids. I design maps with intuitive color schemes, legends, and labels to make the information understandable at a glance. Using tools like ArcGIS or QGIS, I can create thematic maps that highlight key insights. Tell a Story with the Data: Instead of just presenting data points, I aim to tell a story that connects the data to real-world implications. I use simple analogies and focus on the ‘why’—why this data matters and how it impacts decision-making. For example, instead of saying ‘the land use has changed by 25%,’ I might say, ‘the increase in green spaces has improved community access to parks by 25%, promoting better health and well-being.’ By focusing on clarity, visualization, and storytelling, I ensure that complex geospatial data is communicated effectively, helping the audience grasp its significance and make informed decisions. 4. What would you do if a resident came into the office and was upset at the new property lines? If a resident came into the office upset about the new property lines, my first step would be to remain calm and listen carefully to their concerns. I would acknowledge their feelings and let them explain the issue fully without interrupting. It’s important to show empathy and make the resident feel heard, as property lines can be a sensitive topic for many people. After understanding their concerns, I would review the map or documentation with them, explaining how the property lines were determined using reliable data sources like land surveys, legal documents, or GIS analysis. I would present the information in a clear and non-technical way, using visuals if necessary, to help them understand the basis for the changes. If the resident still has doubts or if the situation requires further investigation, I would offer to escalate the issue by collaborating with the surveying team or relevant department for a detailed review. I would assure them that their concerns are being taken seriously and that we will follow up with any necessary adjustments or clarifications. Finally, I would document the interaction and take note of the resident’s feedback to ensure the issue is addressed properly and to prevent similar misunderstandings in the future. 5. Describe a time when you had to collaborate with other departments or teams on a project. How did you ensure smooth communication? … Read more

15 Must-Ask Interview Questions for Cartographer

Interview Questions for Cartographer

Hiring the right cartographer is crucial for any organization involved in mapping, spatial analysis, or geographic data representation. A cartographer’s role goes beyond creating maps—they interpret complex data, communicate geographic trends, and ensure the accuracy of spatial information. If you’re looking to hire, this guide covers the 15 must-ask interview questions for cartographer candidates, helping you find the right talent for your team. 1. Can You Explain Your Experience in Cartography? Start your interview with this essential question. Understanding a candidate’s background and experience is critical when asking 15 must-ask interview questions for cartographer roles. Look for candidates who have experience in map design, GIS software, and geospatial analysis. 2. What Tools and Software Do You Use for Map Design? A skilled cartographer is proficient in various mapping tools like ArcGIS, QGIS, and Mapbox. Asking about the tools they use is one of the 15 must-ask interview questions for cartographer positions, as it helps assess their technical capabilities. 3. How Do You Ensure the Accuracy of Your Maps? Accuracy is key in cartography. This is one of the critical 15 must-ask interview questions for cartographer candidates, as it reveals their methods for data validation and quality control. 4. Can You Describe a Complex Mapping Project You’ve Worked On? This question assesses a candidate’s ability to handle complex projects. Including it in your list of 15 must-ask interview questions for cartographer roles helps you gauge their problem-solving skills and project management experience. 5. How Do You Handle Data Integration from Multiple Sources? Cartographers often work with data from various sources. Asking about their data integration process is essential when listing 15 must-ask interview questions for cartographer candidates, as it reveals their ability to combine datasets effectively. 6. What Is Your Approach to Map Design and Aesthetics? Map design isn’t just about data—it’s also about visual appeal. This is one of the key 15 must-ask interview questions for cartographer interviews, focusing on the candidate’s creativity and design sense. Read Also: 10 Commonly Asked Questions in a GIS Analyst Interview 7. How Do You Stay Updated with Cartography Trends and Technology? The field of cartography is evolving rapidly. This is one of the 15 must-ask interview questions for cartographer candidates that helps determine their commitment to continuous learning and staying updated with industry trends. 8. Can You Explain the Importance of Scale in Cartography? Understanding scale is fundamental in map creation. Asking this question as part of your 15 must-ask interview questions for cartographer roles helps evaluate the candidate’s knowledge of map accuracy and representation. 9. How Do You Communicate Geographic Data to a Non-Technical Audience? Cartographers must be able to present complex data in an understandable way. This is one of the critical 15 must-ask interview questions for cartographer interviews to assess the candidate’s communication skills. 10. What Steps Do You Take to Validate Geospatial Data? Data validation is a crucial step in map-making. Including this in your 15 must-ask interview questions for cartographer list will help you understand the candidate’s attention to detail and commitment to accuracy. 11. How Would You Approach Creating a Thematic Map? Thematic maps are used to visualize specific data themes. This question is essential in your 15 must-ask interview questions for cartographer guide, as it tests the candidate’s ability to interpret data and present it visually. Read Also: 60+ Geomatics Engineering Interview Question and Answers 12. Can You Give an Example of a Time When You Had to Correct a Significant Error in a Map? Mistakes happen, but it’s how they’re fixed that matters. This question, part of the 15 must-ask interview questions for cartographer, helps identify problem-solving skills and accountability. 13. How Do You Incorporate User Feedback into Your Map Designs? User feedback is invaluable in creating effective maps. Asking about it is one of the 15 must-ask interview questions for cartographer interviews to assess the candidate’s adaptability and responsiveness. 14. What Challenges Have You Faced in Cartography, and How Did You Overcome Them? This question helps reveal the candidate’s resilience and problem-solving approach. It’s an essential part of the 15 must-ask interview questions for cartographer list, providing insights into their experience and mindset. 15. Why Do You Want to Work as a Cartographer at Our Organization? End the interview with this question to assess cultural fit and motivation. It’s a vital part of the 15 must-ask interview questions for cartographer guide, helping you understand the candidate’s enthusiasm and interest in your organization. Bonus Questions Here are 3 additional bonus questions that dive deeper into practical scenarios and problem-solving skills for a cartographer: Bonus Question 1: How Would You Create a Map for an Area with Limited or Incomplete Data? In real-world projects, cartographers often face situations where data is missing or incomplete. This question helps you gauge the candidate’s creativity and ability to adapt. Look for answers that mention techniques like data interpolation, using remote sensing imagery, or gathering additional field data. Bonus Question 2: Can You Describe a Situation Where You Had to Balance Accuracy and Aesthetics in Map Design? Cartographers must often strike a balance between visual appeal and data precision. This question tests the candidate’s understanding of map design principles and their ability to make decisions based on the project’s needs. Strong candidates will mention user-centered design, choosing the right color schemes, and ensuring data readability. Bonus Question 3: How Would You Handle a Request for a Map Update When the Timeline Is Extremely Tight? This question assesses the candidate’s time management and prioritization skills. It’s common for cartographers to face urgent requests for updates, especially in disaster response or rapid project changes. Look for responses that include prioritizing critical tasks, using automated scripts, or working with preprocessed data to save time. Conclusion Asking the right questions is key to finding a talented cartographer who can bring valuable skills to your team. By using these 15 must-ask interview questions for cartographer candidates, you’ll be better equipped to evaluate their expertise, creativity, and problem-solving abilities. Whether you’re hiring for a small project … Read more