The 5 Essential Components of GIS
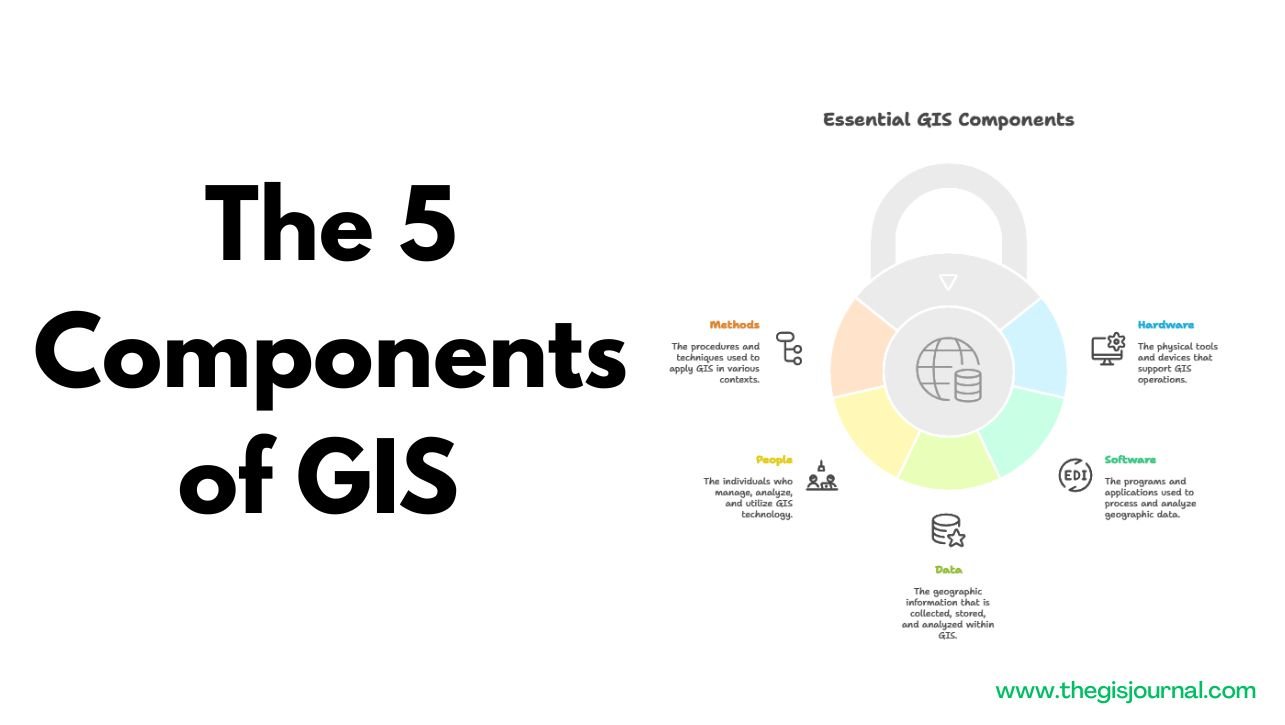
This document provides a concise overview of the five essential components that constitute a Geographic Information System (GIS). These components are hardware, software, data, people, and methods, each playing a crucial role in the effective implementation and utilization of GIS technology. Understanding these components is fundamental to grasping the capabilities and applications of GIS across various fields. The 5 Components of GIS 1. Hardware Hardware forms the technological foundation upon which GIS operates. It encompasses all the physical devices necessary for running GIS software, processing spatial data, and visualizing results. Key hardware components include: Computers: High-performance desktop computers, laptops, and workstations are essential for running GIS software, performing complex spatial analyses, and managing large datasets. The processing power, memory, and storage capacity of these computers directly impact the speed and efficiency of GIS operations. Data Essential GIS Components Hardware Methods People Software The geographic information that is collected, stored, and analyzed within GIS. The individuals who manage, analyze, and utilize GIS technology. The physical tools and devices that support GIS operations. The procedures and techniques used to apply GIS in various contexts. The programs and applications used to process and analyze geographic data. Servers: Servers play a critical role in storing, managing, and distributing spatial data across networks. They enable multiple users to access and work with GIS data simultaneously, facilitating collaboration and data sharing within organizations. GPS Devices: Global Positioning System (GPS) devices are used to collect accurate location data in the field. These devices receive signals from satellites to determine the coordinates of points, lines, and polygons, which can then be imported into GIS software for mapping and analysis. Mobile Devices: Smartphones and tablets equipped with GPS capabilities and GIS apps are increasingly used for field data collection, navigation, and real-time mapping. These devices enable users to access and update spatial data on the go, enhancing efficiency and productivity. Printers and Plotters: Large-format printers and plotters are used to produce high-quality maps and other visual outputs from GIS software. These devices are essential for communicating spatial information to a wider audience. Digitizers and Scanners: Digitizers are used to convert analog maps and drawings into digital format, while scanners are used to capture images of maps and other documents. These devices enable the integration of historical and legacy data into GIS databases. 2. Software Software comprises the programs and applications that enable users to interact with spatial data, perform analyses, and create maps. GIS software provides a range of tools and functionalities for data management, spatial analysis, visualization, and cartography. Popular GIS software packages include: ArcGIS: Developed by Esri, ArcGIS is a comprehensive suite of GIS software that includes desktop, server, and online components. It offers a wide range of tools for data management, spatial analysis, mapping, and application development. QGIS: QGIS (Quantum GIS) is a free and open-source GIS software that provides a powerful alternative to commercial GIS packages. It offers a wide range of features for data visualization, spatial analysis, and map creation, and it supports a variety of data formats. Google Earth: Google Earth is a virtual globe, map, and geographical information program. It allows users to explore the Earth through satellite imagery, aerial photography, and 3D models. While not a full-fledged GIS, Google Earth is useful for visualizing spatial data and creating simple maps. ERDAS IMAGINE: ERDAS IMAGINE is a remote sensing software used for processing and analyzing satellite imagery and aerial photography. It provides tools for image classification, feature extraction, and change detection. ENVI: ENVI (Environment for Visualizing Images) is another remote sensing software used for analyzing geospatial imagery. It offers a wide range of tools for image processing, analysis, and visualization. 3. Data Data is the lifeblood of GIS. It encompasses all the spatial and attribute information that is stored, managed, and analyzed within a GIS. Spatial data represents the location and shape of geographic features, while attribute data describes the characteristics of those features. Key types of GIS data include: Maps: Maps are graphical representations of geographic features and their attributes. They can be in digital or analog format and can depict a wide range of information, such as topography, land use, transportation networks, and political boundaries. Satellite Images: Satellite images are captured by sensors on board satellites and provide a bird’s-eye view of the Earth’s surface. They are used for a variety of applications, such as land cover mapping, environmental monitoring, and disaster assessment. Aerial Photography: Aerial photography is captured by cameras mounted on aircraft and provides high-resolution images of the Earth’s surface. It is used for a variety of applications, such as urban planning, infrastructure mapping, and agricultural monitoring. Survey Data: Survey data is collected using surveying instruments and techniques to determine the precise location and elevation of points on the Earth’s surface. It is used for creating accurate maps and models of the terrain. Location Information: Location information includes addresses, coordinates, and other data that can be used to identify the location of geographic features. It is used for geocoding, routing, and other location-based services. Demographic Data: Demographic data includes information about the population, such as age, gender, income, and education level. It is used for analyzing population trends, identifying target markets, and planning public services 4. People People are the users and managers of GIS technology. They are the ones who collect, analyze, and interpret spatial data, create maps, and make decisions based on GIS analysis. Key roles in GIS include: GIS Analysts: GIS analysts are responsible for analyzing spatial data, creating maps, and developing GIS applications. They use GIS software and techniques to solve a variety of problems in fields such as urban planning, environmental management, and public health. GIS Technicians: GIS technicians are responsible for collecting, processing, and managing spatial data. They use GPS devices, digitizers, and scanners to create and update GIS databases. GIS Managers: GIS managers are responsible for overseeing the implementation and management of GIS technology within an organization. They develop GIS strategies, manage GIS budgets, and supervise GIS staff. Urban Planners: … Read more