The Ethical Frontier: 5 Critical Questions for Using AI in Geomatics

AI in Geomatics

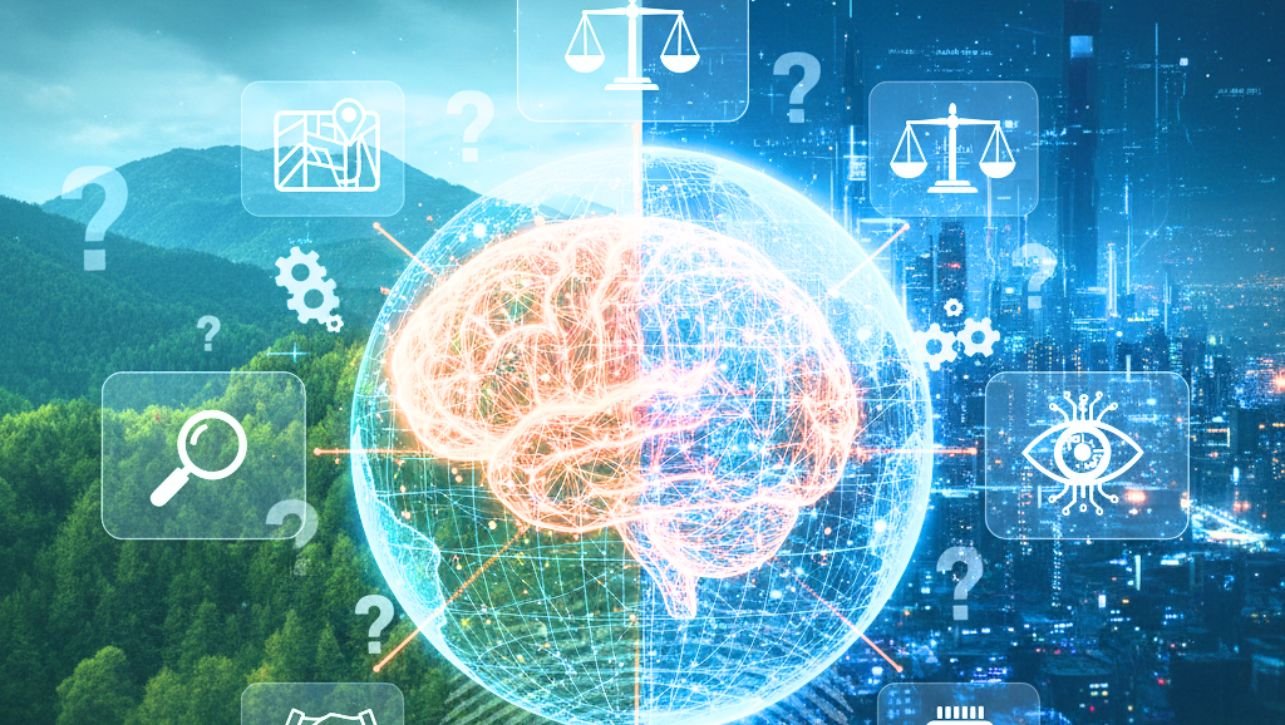
We’re living in a golden age for AI in Geomatics. Artificial Intelligence is supercharging our ability to map, measure, and understand our world. We can now extract every building from a continent-spanning satellite image, predict urban sprawl with startling accuracy, and monitor environmental changes in near real-time. The power is incredible—but with great power comes great responsibility. As we integrate AI deeper into our workflows, we’re stepping onto a new ethical frontier. The speed and automation of AI can amplify not just our efficiencies, but also our oversights and biases. It’s no longer enough to ask, “Can we build this model?” We must now ask, “Should we?” and “What are the consequences?” Here are five critical ethical questions every Geomatics professional, project manager, and policymaker must confront. 1. Is Our Data Perpetuating a Bias? The Problem: An AI model is only as good as the data it’s trained on. If our training data is incomplete or unrepresentative, the AI will learn and automate those flaws. The Geospatial Example: Imagine training a model to identify “formal” residential buildings from satellite imagery. If you only train it on data from wealthy, developed neighborhoods with distinct architectural styles, it may fail to recognize informal settlements or housing in developing regions. This isn’t just a technical error; it’s a form of algorithmic erasure. These “missing” areas could then be excluded from urban planning, resource allocation, and disaster relief maps, further marginalizing vulnerable populations. The Question to Ask: “Who and what is underrepresented or misrepresented in our training data, and how can we fix it?” 2. Who is Accountable for the AI’s Decision? The Problem: The “black box” nature of some complex AI models can make it difficult to understand why a specific decision was made. When an AI-driven analysis leads to a consequential outcome, who is responsible? The Geospatial Example: A municipality uses an AI model to identify properties at high risk for building code violations, prioritizing them for inspection. The model, due to a hidden bias, overwhelmingly flags older neighborhoods. This leads to disproportionate fines and enforcement in these communities. When challenged, the city points to the “impartial algorithm.” But who is truly accountable? The data scientist who built the model? The geomatics engineer who validated the data? The city official who approved its use? The Question to Ask: “Where does the chain of accountability lie, from model creation to deployment, and do we have processes to audit and explain its outputs?” 3. Where is the Line on Privacy? The Problem: The resolution of satellite and drone imagery is now so high that we can see cars and people. When combined with other data sources, AI can track patterns of life, identify individuals’ habits, and infer sensitive information. The Geospatial Example: A company uses AI analysis of high-res drone footage to count cars in a competitor’s parking lot to estimate their business performance. The same technology could be used to track an individual’s movement from their home to a medical clinic, inferring a health condition. This moves mapping from observing the landscape to monitoring individuals, raising serious privacy concerns. The Question to Ask: “Does our use of geospatial AI respect individual privacy, and have we obtained proper consent or anonymized data to prevent harm?” Read Also: How Do Drones (UAVs) Collect GIS Data? The Complete 2025 Guide ArcGIS Pro vs. QGIS: The Ultimate 2025 Showdown (Pros, Cons & Verdict) Multispectral vs. Hyperspectral Imagery: A Clear-Cut Guide For 2025 4. Are We Creating a New Digital Divide? The Problem: Access to the vast computational resources, expensive data, and specialized talent required for AI is not equal. This risks creating a world where only wealthy corporations and nations can wield the most powerful geospatial tools. The Geospatial Example: A developing country lacks the resources to build an AI model for monitoring its coastal erosion. A foreign corporation, however, has a sophisticated model and uses it to identify and acquire valuable coastal land that is currently undervalued. The technology, meant to be a tool for empowerment, instead becomes an instrument of exploitation, widening the gap between the data-rich and the data-poor. The Question to Ask: “How can we promote open data, open-source tools, and knowledge sharing to ensure the benefits of geospatial AI are distributed equitably?” 5. What are the Unintended Environmental and Social Consequences? The Problem: Optimizing for a single, narrow goal can have negative ripple effects that the AI is not designed to see. The Geospatial Example: An AI is tasked with finding the most efficient route for a new highway. It perfectly minimizes construction cost and travel time by routing it through a forest. It “succeeds” at its task, but in doing so, it fragments a critical wildlife corridor and displaces a local community—consequences that were not in its cost function. The AI provided a technically correct answer to the wrong, or too-narrow, question. The Question to Ask: “Beyond our primary objective, what secondary social, economic, and environmental impacts should we model and mitigate?” Navigating the Frontier Responsibly The goal isn’t to halt progress. It’s to guide it. As Geomatics engineers and spatial thinkers, we have a unique responsibility. We are the bridge between the abstract world of data and the physical world where people live. Before you deploy your next AI model, make these ethical questions part of your standard project checklist. Foster diverse teams to help spot biases. Advocate for transparency and documentation. Remember, we are not just building models; we are shaping the lens through which we see and interact with our world. Let’s ensure it’s a lens of clarity, fairness, and responsibility.

What is LiDAR? A Simple 2025 Guide to How It Works & Its Uses

LiDAR

Look around you. In 2025, an invisible dance of light is happening all around us, shaping your daily life in ways you might not even notice. It’s guiding your new car, helping architects preserve historic sites, and even assisting doctors in complex surgeries. This invisible force is LiDAR. Once a bulky, expensive tool for scientists and surveyors, LiDAR has exploded into the mainstream. But what is LiDAR, and why has it become so fundamental to our technological future? This isn’t just a guide to what LiDAR is—it’s a look at how it’s actively building a smarter, safer, and more precisely mapped world. What is LiDAR?  LiDAR, which stands for Light Detection and Ranging, is a remote sensing method that uses light in the form of a pulsed laser to measure variable distances to the Earth. Here’s the simplest analogy: Imagine millions of tiny, invisible laser tape measures firing every second, building a precise, three-dimensional map of everything they touch. These pulses of light—each one a single photon—bounce off objects like trees, cars, and buildings and return to the sensor. By measuring the time it takes for each pulse to return (Time of Flight) and using the known speed of light, the system calculates an exact distance. After firing billions of these pulses, a hyper-accurate “point cloud”—a massive collection of individual data points in 3D space—is created. How LiDAR Works in 2025: Smarter, Smaller, and Solid-State The core principle remains, but the technology has evolved dramatically. Here’s the 2025 breakdown: Emission: A laser emitter sends out a focused beam of light. In 2025, these are more efficient and eye-safe than ever. Scanning: The light hits a scanning mechanism. While mechanical spinners were once common, 2025 is the era of Solid-State LiDAR. No Moving Parts: Solid-state systems use microscopic antennas on a chip to steer the laser beam electronically. This makes them cheaper, more reliable, smaller, and perfect for mass-market applications like consumer vehicles and phones. Detection: The photodetector receives the reflected light. Processing: Advanced onboard AI and processors calculate the distance for each point and use the scanner’s position data to assemble the final 3D point cloud in real-time. The LiDAR Revolution: Why 2025 is a Tipping Point Three key trends have propelled LiDAR into the spotlight: The Mass-Market Automotive Push: With major automakers rolling out Level 3 automated driving systems, LiDAR has become a critical sensor for creating a fail-safe 3D view of the road, complementing cameras and radar. Consumer Electronics Integration: Apple embedding LiDAR in iPhones and iPads normalized the technology for millions, enabling everything from instant room measurements to next-level AR gaming. The “Democratization” of Data: Affordable, drone-mounted LiDAR systems and user-friendly processing software have put powerful mapping capabilities in the hands of small businesses, researchers, and farmers. Read Also:  LiDAR vs. Photogrammetry: The Ultimate 2025 Showdown (Pros, Cons & Verdict) How Do Drones (UAVs) Collect GIS Data? ArcGIS Pro vs. QGIS: The Ultimate 2025 Showdown (Pros, Cons & Verdict) LiDAR in Action: The 2025 Use-Case Landscape 1. Autonomous Vehicles & Smart Transportation LiDAR is the high-fidelity eyes of self-driving cars. In 2025, it doesn’t just “see” an object; it precisely identifies its轮廓, calculates its velocity, and predicts its path, even in pitch darkness or blinding sun. It’s essential for differentiating a harmless plastic bag from a stray tire on the highway. 2. Environmental Monitoring & Climate Science Carbon Stock Assessment: Satellites and aircraft with LiDAR are precisely measuring forest biomass on a global scale, making carbon credit markets more accurate and fighting deforestation. Coastal Resilience: By regularly mapping coastlines, scientists can track erosion from sea-level rise with centimeter accuracy, informing vital protection strategies. 3. Digital Twins & the Metaverse Every major city and corporation is building a “digital twin”—a live, virtual replica of the real world. LiDAR is the primary tool for scanning physical assets—from entire factories to infrastructure networks—to create the foundational 3D model for simulation, planning, and the industrial metaverse. 4. Augmented Reality (AR) & Mobile Computing The LiDAR scanner in your phone or AR glasses does one thing incredibly well: it understands the geometry of your surroundings. This allows digital objects to interact realistically with your physical space—a virtual character hiding behind your real sofa, or an IKEA chair perfectly fitting in your living room. 5. Archaeology & Cultural Heritage Researchers are using drones with LiDAR to discover lost cities and ancient earthworks hidden beneath dense jungle canopies, revolutionizing our understanding of human history without ever breaking ground. LiDAR vs. The World: How It Stacks Up in 2025 No sensor is perfect. LiDAR’s role is best understood in a suite of technologies: LiDAR vs. Cameras (Photogrammetry): LiDAR provides its own light source and captures exact geometry and distance natively. Cameras provide rich texture and color but struggle with precise scale and low light. In 2025, the trend is Sensor Fusion—combining LiDAR’s 3D data with camera imagery for a complete picture. LiDAR vs. Radar: Radar is excellent at measuring speed and works in all weather conditions, but it has very low resolution. LiDAR provides the high-resolution 3D shape that radar cannot. The Future of LiDAR: What’s Next? (2025 and Beyond) The evolution is accelerating. Key trends to watch: Chip-Scale LiDAR: LiDAR sensors will shrink to the size of a postage stamp, becoming cheap and ubiquitous enough to be embedded in every robot, smart device, and traffic light. Quantum LiDAR: Emerging quantum technologies will lead to LiDAR systems with unprecedented sensitivity, capable of seeing further and through obscurants like fog and smoke more effectively. AI-Native LiDAR: Sensors will have AI built directly into the hardware, allowing them to not just collect raw data, but to identify and classify objects (e.g., “pedestrian,” “cyclist”) at the source, dramatically speeding up processing. Conclusion: What is LiDAR? LiDAR is no longer a niche technology. It has become a fundamental utility for perceiving and interacting with our world, as transformative as the GPS signal itself. It answers a simple but profound question with incredible precision: “Where are things, and what is their shape?” As we march toward a more automated and digitally integrated future, LiDAR provides the essential spatial context … Read more

LiDAR vs. Photogrammetry: The Ultimate 2025 Showdown (Pros, Cons & Verdict)

LiDAR vs. Photogrammetry

In the quest to digitally capture our world in three dimensions, two technologies reign supreme: LiDAR Vs. Photogrammetry. From creating immersive digital twins of cities to monitoring ancient archaeological sites, the demand for accurate 3D data has never been higher. But if you’re planning a drone survey, an aerial mapping project, or a ground-based scan, you face a critical decision: which technology is right for you? The choice between LiDAR and Photogrammetry isn’t about one being universally “better”—it’s about matching the right tool to your project’s specific needs, budget, and deliverables. This ultimate 2025 showdown will cut through the hype, giving you a clear, unbiased comparison to help you make the most informed decision. The 30-Second Summary: LiDAR vs. Photogrammetry Feature LiDAR (Light Detection and Ranging) Photogrammetry How It Works Measures distances with laser pulses. Calculates 3D from 2D photos (Structure from Motion). Primary Output 3D Point Cloud (x,y,z coordinates) 3D Textured Mesh & Orthomosaic Accuracy (Vegetation Penetration) Excellent. Can see through gaps to ground. Poor. Sees only the top of the canopy. Visual Realism Poor (no inherent color/texture). Excellent. Photo-realistic textures. Speed of Data Capture Very Fast (direct measurement). Slower (requires high overlap). Cost High (hardware & processing) Low to Moderate (standard cameras & software) Best For Mapping under vegetation, power lines, complex structures. Visual deliverables, large-area mapping, volume calculations.   The Deep Dive: How They Work What is LiDAR? (The Laser Ruler) LiDAR is an active remote sensing method. It works by firing hundreds of thousands of laser pulses per second at a target and measuring the time it takes for each pulse to return to the sensor. The “Point Cloud”: Each return creates a single point with precise X, Y, and Z coordinates. The result is a massive, dense “cloud” of individual points that accurately represents the scanned object or landscape. Multiple Returns: A key advantage is that a single laser pulse can have multiple returns. It can hit a leaf, then a branch, and finally the ground, capturing data at different levels. This is what allows LiDAR to “see through” vegetation. What is Photogrammetry? (The 3D Puzzle Solver) Photogrammetry is a passive method. It uses overlapping 2D photographs taken from different positions to reconstruct a 3D model. Structure from Motion (SfM): Sophisticated software identifies common points in multiple overlapping images. By triangulating the position of these points, it calculates their location in 3D space, creating a dense point cloud, which is then used to generate a 3D mesh. The Textured Mesh: The software then drapes the original photographs over the 3D mesh, creating a photorealistic, “true-color” model. Head-to-Head: The Key Comparison Factors 1. Accuracy and Detail LiDAR: Excels in vertical (Z) accuracy and capturing fine linear details like wires, pipes, and sharp building edges. It is less affected by lighting conditions or surface textures. Photogrammetry: Provides excellent horizontal (X,Y) accuracy. However, its vertical accuracy can be lower than LiDAR, especially in areas with uniform textures (like sand or grass) where the software struggles to find matching points. Verdict: LiDAR wins for vertical accuracy and capturing fine details. Photogrammetry wins for horizontal accuracy on well-textured surfaces. 2. Dealing with Vegetation and Obstructions This is LiDAR’s killer app. LiDAR: Can penetrate small gaps in vegetation to map the ground terrain below, creating an accurate Digital Terrain Model (DTM). This is non-negotiable for forestry, floodplain mapping, and archaeology. Photogrammetry: Can only see the top surface (the canopy), resulting in a Digital Surface Model (DSM). It cannot map what it cannot see. Verdict: LiDAR is the undisputed winner for any project requiring ground data in vegetated areas. 3. Visual Output and Deliverables Photogrammetry: The clear winner for visual appeal. Its outputs—orthomosaics and textured 3D meshes—are instantly recognizable and rich with visual information. This is ideal for presentations, asset inspections, and virtual tours. LiDAR: Produces a monochromatic point cloud. While color can be added by fusing LiDAR data with camera imagery (“RGB LiDAR”), it is an extra step and rarely matches the visual quality of photogrammetry. Verdict: Photogrammetry wins for visually communicative maps and models. LiDAR wins for pure geometric measurement. 4. Cost and Accessibility Photogrammetry: Has a low barrier to entry. You can start with a consumer-grade drone and a $100/month software subscription. The technology is mature and widely understood. LiDAR: Requires a significant investment. A professional drone LiDAR system can cost $30,000 – $100,000+. Processing software is also more specialized and expensive. Furthermore, it requires greater expertise to operate and process the data correctly. Verdict: Photogrammetry is far more cost-effective and accessible for most users. 5. Sunlight and Weather Dependence LiDAR: An active sensor, it can be used day or night. It can also see through some haze and light fog, though heavy rain or fog will scatter the laser beams. Photogrammetry: Requires good, consistent lighting. Shadows, glare, and overcast conditions that change between photos can ruin a dataset. Verdict: LiDAR is more reliable for time-sensitive projects and can operate in a wider range of lighting conditions. Read Also:  ArcGIS Pro vs. QGIS: The Ultimate 2025 Showdown (Pros, Cons & Verdict) Multispectral vs. Hyperspectral Imagery: A Clear-Cut Guide For 2025 8 Common Map Projections: Which One is Right for Your Map? When to Use Which: Your Project Guide Choose LiDAR If Your Project Involves: Forestry Management: Measuring timber volume, canopy structure, and creating DTMs. Infrastructure Corridors: Mapping power lines, pipelines, and rail lines through vegetation. Engineering & Construction: Capturing complex industrial sites with plenty of steelwork and piping. Flood Modeling & Hydrology: Creating highly accurate terrain models of watersheds. Archaeology: Discovering subtle ground features hidden under foliage (e.g., ancient earthworks). Choose Photogrammetry If Your Project Involves: Orthomosaic Map Creation: For high-resolution, “true-color” 2D base maps. Construction Earthworks: Calculating stockpile volumes and cut/fill quantities. Agriculture: Creating NDVI maps and monitoring crop health (requires a multispectral camera). Cultural Heritage & Film: Creating photorealistic 3D models of buildings, statues, and sites for digital archives or visual effects. Marketing & Real Estate: Creating stunning visualizations and virtual tours. The Future is Fusion: The Hybrid Approach The most powerful approach emerging in 2025 is data fusion—using both technologies on the same project. How it works: A drone equipped with both a LiDAR sensor and a high-resolution camera captures data simultaneously. The benefit: You get the geometric precision of LiDAR (e.g., an accurate DTM under … Read more

How Do Drones (UAVs) Collect GIS Data? The Complete 2025 Guide

Collected GIS Data

Imagine needing a highly detailed map of a construction site, a precise volume calculation of a stockpile, or an assessment of crop health across hundreds of acres. A decade ago, this meant hiring a plane for aerial photography, deploying a ground survey crew for weeks, or relying on outdated satellite imagery. Today, the solution takes off from the back of a truck. Drones, or Unmanned Aerial Vehicles (UAVs), are revolutionizing GIS data collection. By acting as low-flying, highly adaptable sensor platforms, they bridge the critical gap between coarse satellite imagery and slow, ground-level surveys. They deliver data with centimeter-level accuracy, on-demand, and at a fraction of the traditional cost. But how does a flying robot transform into a powerful geospatial data collection tool? This guide will demystify the process, from pre-flight planning to the final, actionable map. The Drone Data Collection Workflow: A Step-by-Step Process Collecting GIS data with a drone isn’t just about flying around and taking pictures. It’s a meticulous process that ensures accuracy, completeness, and efficiency. Step 1: Mission Planning (The Blueprint) Before the drone even leaves the ground, careful planning is essential. Define the Objective: What is the final deliverable? A 2D map, a 3D model, a digital surface model (DSM), or a vegetation index? The goal dictates every other parameter. Set the Flight Parameters: Using specialized mobile apps (e.g., DJI Pilot, Pix4Dcapture), the operator defines: Flight Area: The exact polygon of the area to be mapped. Altitude: Determines ground sampling distance (GSD)—the actual size of each pixel on the ground. Lower altitude = higher resolution. Image Overlap: Crucial for quality. Frontlap (or overlap) is typically 70-80%, and sidelap is 60-70%. High overlap ensures every part of the ground is captured from multiple angles, which is critical for 3D model generation. Ground Control Points (GCPs): For survey-grade accuracy, GCPs are essential. These are visible markers placed throughout the survey area whose precise coordinates (X, Y, Z) are collected with a GNSS receiver. The processing software uses these to “geo-reference” the model, tying it to a real-world coordinate system. Step 2: The Data Capture Flight (The Execution) The pilot launches the drone, and it autonomously executes the pre-planned mission. Autonomous Navigation: The drone follows a precise “lawnmower” pattern, automatically capturing images at predetermined intervals. Data Logging: The drone doesn’t just capture images; it also logs the precise location (from its onboard GPS) and orientation (from its Inertial Measurement Unit – IMU) for every single photo. This data is stored in the image’s EXIF metadata. Read Also:  ArcGIS Pro vs. QGIS: The Ultimate 2025 Showdown (Pros, Cons & Verdict) What is a Digital Elevation Model (DEM)? The Complete Guide 2025 What is a TIN (Triangulated Irregular Network)? Step 3: Data Processing (The Magic) This is where the raw images are transformed into geospatial products. The thousands of overlapping images are uploaded to specialized software. Photogrammetry: This is the most common technique. The software uses a process called Structure from Motion (SfM). It identifies common points in multiple overlapping images and triangulates their positions in 3D space, creating a dense point cloud. Output Generation: This point cloud is the foundation for all other products: Orthomosaic Map: A geometrically corrected (“orthorectified”) 2D map where every pixel is scaled uniformly, eliminating distortion from terrain and lens tilt. It’s a seamless, highly accurate image map. Digital Surface Model (DSM): A 3D representation of the earth’s surface, including all objects on it like buildings and trees. Digital Terrain Model (DTM): A 3D representation of the bare earth, with all vegetation and buildings removed. 3D Textured Mesh: A photorealistic, navigable 3D model of the survey area. Step 4: Analysis & Application (The Insight) The final maps and models are imported into GIS software (like ArcGIS Pro or QGIS) where they become powerful layers for spatial analysis. The Sensors: The Eyes of the Drone The type of data collected depends entirely on the sensor mounted on the drone. 1. RGB (Red, Green, Blue) Cameras What they do: Capture standard visible-light photographs. Primary Outputs: High-resolution orthomosaics and 3D models. Applications: Construction progress monitoring Urban planning General mapping and base layer creation Erosion monitoring 2. Multispectral Sensors What they do: Capture data in specific wavelengths of light, including both visible and non-visible bands (e.g., Near-Infrared – NIR, Red Edge). Primary Outputs: Vegetation indices like NDVI (Normalized Difference Vegetation Index), which is a key measure of plant health. Applications: Precision Agriculture: Identifying crop stress, optimizing water and fertilizer use. Environmental Monitoring: Assessing the health of forests and wetlands. Land Management: Detecting invasive species. 3. LiDAR (Light Detection and Ranging) What they do: Emits rapid laser pulses and measures the time it takes for them to return to the sensor, creating a highly accurate “point cloud” of the environment. Primary Outputs: Dense 3D point clouds, highly accurate DTMs. Applications: Forestry: Measuring tree height and canopy structure. Infrastructure & Transmission Line Mapping: Seeing through vegetation to map the ground below. Flood Modeling: Creating accurate terrain models for hydrological analysis. LiDAR vs. Photogrammetry: LiDAR is superior for penetrating vegetation and capturing fine details like power lines, but it is more expensive and doesn’t capture true-color imagery natively. 4. Thermal Sensors What they do: Detect heat signatures (infrared radiation). Primary Outputs: Heat maps and temperature readings. Applications: Solar Farm Inspection: Identifying faulty panels. Search and Rescue: Locating people at night or in dense foliage. Building Inspection: Detecting heat leaks and faulty insulation. Key Advantages of Drone-Collected GIS Data Why has this technology been so disruptive? Unprecedented Resolution & Accuracy: Capture data at a centimeter-level GSD, revealing details invisible to satellites or manned aircraft. Rapid Deployment and On-Demand Data: Map hundreds of acres in a single flight and get the data the same day. This is critical for time-sensitive projects and rapid response in disasters. Enhanced Safety: Drones can access hazardous or difficult-to-reach areas without risking human lives—inspecting unstable slopes, cell towers, or disaster zones. Cost-Effectiveness: Drone surveys are significantly cheaper than traditional manned aerial surveys or large, ground-based survey crews. Rich, Comprehensive Datasets: A single flight can generate a suite of interrelated products (2D map, 3D model, elevation model) from one data source. Real-World Applications: Drones in Action Construction: Tracking earthwork volumes, monitoring site progress against BIM models, and conducting safety inspections. Agriculture: Creating prescription maps for … Read more

8 Common Map Projections: Which One is Right for Your Map?

8 Common Map Projections and Their Uses

Try to peel an orange and flatten the peel onto a table. What happens? It cracks, tears, and stretches. This is the fundamental challenge cartographers face when representing our spherical Earth on a flat surface: it’s mathematically impossible without distortion. The method they use to make this conversion is called a map projection. Every projection is a trade-off, prioritizing one property—like accurate shape, area, distance, or direction—at the expense of others. Choosing the right one is the first and most critical step in making an honest and effective map. In this guide, we’ll explore 8 common map projections, how they distort our world, and the specific jobs they were designed to do. The Cartographer’s Dilemma: What Gets Distorted? All map projections introduce at least one of these four types of distortion: Shape (Conformality): Can the shapes of continents and coastlines be preserved? Area (Equivalence): Can the relative sizes of landmasses be accurately represented? Distance: Can accurate measurements between points be maintained? Direction: Can straight lines represent true compass bearings? No single projection can preserve all four. You must choose which property is most important for your purpose. The 8 Common Map Projections and Their Uses Here are the most widely recognized map projections, each with its own strengths and weaknesses. 1. Mercator Projection Best For: Navigation Property Preserved: Shape (Conformal) and Direction. The Trade-Off: Severely distorts area, especially near the poles. Why You Know It: This is the map that defined most classroom walls for decades. It’s a cylindrical projection where lines of constant bearing (rhumb lines) are straight, making it perfect for sailors to plot a straight-line course. However, it infamously makes Greenland look larger than Africa, when in reality Africa is 14 times larger. 2. Gall-Peters Projection Best For: Thematic Mapping (e.g., population, resource distribution) Property Preserved: Area (Equal-Area). Trade-Off: Severely distorts shape, stretching landmasses vertically near the equator and compressing them near the poles. Why You Know It: Created as a response to the Mercator’s area distortion, the Gall-Peters projection shows all countries at their true relative size. It was adopted by many educational and international organizations for its ability to represent developing nations more accurately. 3. Robinson Projection Best For: General-Purpose World Maps Property Preserved: Aesthetic balance. Trade-Off: Distorts shape, area, scale, and distance, but very little of any one. Why You Know It: This was National Geographic’s standard for decades. Arthur Robinson’s goal was to create a visually pleasing map that wasn’t wildly inaccurate in any one aspect. It’s a compromise projection that works well for general reference. Read Also: ArcGIS Pro vs. QGIS: The Ultimate 2025 Showdown (Pros, Cons & Verdict) What is a Digital Elevation Model (DEM)? The Complete Guide 2025 Multispectral vs. Hyperspectral Imagery: A Clear-Cut Guide For 2025 4. Winkel Tripel Projection Best For: General-Purpose World Maps Property Preserved: Aesthetic balance (an even better compromise than Robinson). Trade-Off: Minor distortions in all properties, but none are extreme. Why You Know It: This is the current gold standard for world reference maps and is used by National Geographic today. It provides an excellent overall balance, with less distortion at the poles than the Robinson. 5. Goode Homolosine Projection Best For: Spatial Distribution (e.g., mapping ocean currents or climate data) Property Preserved: Area (Equal-Area). Trade-Off: Interrupted; it cuts the world’s oceans to preserve continent shapes and sizes, disrupting the overall global view. Why You Know It: Its distinctive, interrupted look makes it unforgettable. By “snipping” the map in the oceans, it minimizes shape distortion on the continents while maintaining true area. 6. Azimuthal Equidistant Projection Best For: Showing Distances from a Specific Point Property Preserved: Distance and Direction from the central point. Trade-Off: Distortion increases dramatically the farther you get from the center point. Why You Know It: This is the projection used for the United Nations logo (centered on the North Pole). It’s perfect for airline route maps from a specific hub or for showing the broadcast range of a radio antenna. 7. Transverse Mercator Projection Best For: Large-Scale Mapping (e.g., topographic maps, property surveys) Property Preserved: Shape (Conformal) and Scale along a central north-south line. Trade-Off: Distortion increases east and west of the central meridian. Why You Know It: This is the workhorse of large-scale mapping. It forms the basis for the Universal Transverse Mercator (UTM) coordinate system, used by the military, surveyors, and GIS professionals worldwide for its high accuracy over narrow zones. 8. Conic Projection Best For: Mid-Latitude Regions with an east-west orientation (e.g., the United States, Russia, China) Property Preserved: Shape (Conformal) and Distance along standard parallels. Trade-Off: Distortion increases north and south of the standard parallels. Why You Know It: Imagine placing a cone over a globe. This projection is excellent for mapping countries in the mid-latitudes, which is why it has been used for official topographic mapping in the US (the Lambert Conformal Conic). How to Choose the Right Map Projection Your choice should be guided by a single question: What is the primary purpose of my map? For Navigation: Use Mercator. For Showing Thematic Data by Area (e.g., population density): Use an Equal-Area projection like Gall-Peters or Goode Homolosine. For a General-Reference World Map: Use a compromise projection like Winkel Tripel or Robinson. For Mapping a Specific Country or Region: Use a projection optimized for that latitude, like Conic for mid-latitudes or Transverse Mercator for local accuracy. For Showing Distances from a City: Use an Azimuthal Equidistant projection centered on that city. Conclusion: Common Map Projections Every map is a model, a purposeful representation of reality. The “best” map projection doesn’t exist; there is only the most appropriate one for your task. By understanding the trade-offs behind these 8 common map projections, you move from being a passive reader of maps to an informed creator, capable of choosing a projection that tells your story truthfully and effectively. The next time you look at a world map, don’t just see the countries—see the choices the cartographer made, and the story those choices are trying to tell. FAQ: Common Map Projections Q: What is the most accurate world map projection? A: There is no single “most accurate” projection for the entire world. The only truly accurate representation of the Earth is a globe. For flat maps, the choice depends entirely on which property (shape, area, distance, direction) you need to be accurate for your purpose. Q: Why is the Mercator projection still so common if it distorts size? A: Its preservation of shape and direction makes it incredibly … Read more

What is Geofencing? The Ultimate Guide to Digital Boundaries (2025)

Geofencing

Imagine walking past your favorite coffee shop and instantly receiving a notification for a “20% Off Your Next Latte” coupon. Or picture a parent receiving an automatic alert the moment their child’s school bus arrives on campus. These aren’t scenes from a sci-fi movie; they are everyday realities powered by geofencing. But what is geofencing? In simple terms, it’s a location-based service that creates a virtual geographic boundary, or a “geofence.” When a enabled device (like a smartphone or a vehicle tracker) enters or exits this boundary, it automatically triggers a predefined action. This powerful technology is quietly revolutionizing industries from retail to logistics. In this guide, we’ll break down how geofencing works, explore its game-changing applications, and discuss what the future holds for these invisible digital boundaries. What is Geofencing? A geofence is a virtual perimeter for a real-world geographic area. Think of it as an invisible fence drawn on a digital map. This boundary can be as small as a single room or as large as an entire city. The magic happens when a GPS, RFID, Wi-Fi, or cellular-data-enabled device interacts with this boundary. The system detects this cross-over event (an “enter,” “exit,” or “dwell”) and automatically executes a response. This response can be: Sending a push notification or SMS Triggering an email Dispatching an alert to a security team Collecting and logging data Turning smart devices on or off How Does Geofencing Work? The Technology Behind the Magic Geofencing relies on a combination of technologies to pinpoint a device’s location and detect when a boundary is crossed. Defining the Fence: A user first defines the geofence using a web-based dashboard or a mobile application. They can draw a radius around a point or create a complex polygon around a specific area. Location Tracking: The target device uses one or more of the following to determine its location: GPS: The most accurate method, ideal for outdoor use. Wi-Fi Positioning: Uses nearby Wi-Fi networks to triangulate position, effective in urban areas. Cellular Data: Uses proximity to cell towers, less accurate but uses less battery. Bluetooth Beacons: Used for hyper-accurate, small-scale geofencing indoors (e.g., within a store). The Trigger: The geofencing software continuously monitors the device’s location. The moment a “crossing event” is detected, it sends this information to a server. The Action: The server then executes the pre-programmed action, such as sending a notification to the user or logging the event in a database. Read Also:  What is a Digital Elevation Model (DEM)? The Complete Guide 2025 What is a TIN (Triangulated Irregular Network)? ArcGIS Pro vs. QGIS: The Ultimate 2025 Showdown (Pros, Cons & Verdict) Geofencing in Action: Real-World Applications Across Industries The true power of geofencing lies in its versatility. Here’s how different sectors are leveraging this technology. 1. Marketing and Retail Proximity Marketing: As in our intro example, retailers send targeted offers and promotions to potential customers when they are near a store. Enhancing Customer Experience: Museums can send exhibit information to visitors as they approach a specific display. Competitor Conquesting: A brand can set up a geofence around a competitor’s location and send special offers to users within that area. 2. Logistics and Fleet Management Asset Tracking: Companies can monitor the real-time location of vehicles and equipment. Automated Arrival/Departure Logs: Geofences around a warehouse can automatically log truck arrival and departure times, eliminating manual paperwork and improving efficiency. Theft Prevention: If a high-value asset moves outside a designated geofence without authorization, an immediate alert can be sent. 3. Security and Safety Child and Elderly Care: Parents can set up geofences around a school or a park. They receive an instant notification when their child arrives or leaves the area. Construction Sites: Geofences can secure hazardous areas, sending alerts if unauthorized personnel or equipment enter a restricted zone. Smart Home Automation: Your “Welcome Home” scene—turning on lights and adjusting the thermostat—can be triggered automatically when your phone crosses the geofence around your house. 4. Human Resources and Workforce Management Time and Attendance: For mobile workers, geofences can automatically clock them in and out when they arrive at and leave a job site. Task Automation: Field service technicians can be automatically assigned a new job ticket the moment they enter a client’s geofenced property. The Benefits and Challenges of Geofencing Benefits: Hyper-Targeting: Reaches the right user at the right place and time. Increased Efficiency: Automates tasks that were previously manual. Enhanced Security: Provides real-time monitoring and instant alerts. Valuable Data Collection: Offers insights into customer behavior and asset movement. Challenges and Considerations: Privacy Concerns: The most significant hurdle. Users must opt-in and understand how their location data is being collected and used. Battery Drain: Continuous location tracking can consume significant device battery life. Accuracy Limitations: Location accuracy can vary depending on the technology used (GPS, Wi-Fi, etc.). Notification Fatigue: Overusing push notifications can lead to users disabling the app or finding the brand intrusive. The Future of Geofencing: What’s Next? Geofencing technology is rapidly evolving. Key trends to watch include: AI Integration: Artificial Intelligence will analyze geofencing data to predict behavior, allowing for even more personalized and timely triggers. Indoor Geofencing with Beacons: Bluetooth Low Energy (BLE) beacons will enable hyper-accurate geofencing inside airports, malls, and stadiums. IoT Expansion: As more devices become “smart,” geofencing will automate interactions between your car, home, and workplace seamlessly. AR-Enhanced Experiences: Entering a geofence could trigger augmented reality experiences, like historical information overlays at a landmark. Conclusion: Geofencing Geofencing has moved from a niche technology to a mainstream tool that is reshaping how businesses interact with the physical world. By creating dynamic, digital boundaries, organizations can automate processes, enhance security, and deliver contextually relevant experiences that were once impossible. As with any powerful technology, it must be implemented responsibly, with a strong emphasis on user privacy and transparency. But one thing is clear: the invisible fences of geofencing are here to stay, and they will only become more intelligent and integrated into our daily lives. FAQ: Geofencing Q: Is geofencing legal? A: Yes, but it requires user consent. Apps must request permission to access a user’s location data. Regulations like GDPR and CCPA have strict rules on how this data is collected and stored. Q: Does geofencing work when … Read more

What is a Digital Elevation Model (DEM)? The Complete Guide 2025

What is a Digital Elevation Model DEM

Imagine you have a map of your favorite national park. It shows you trails, rivers, and forests, but it’s flat. Now, imagine if that map could spring to life, revealing the towering peaks, deep valleys, and rolling hills that define its true character. This is the power of a Digital Elevation Model (DEM). A DEM is more than just a pretty 3D visualization; it is a fundamental geospatial dataset that forms the backbone of countless analyses in fields ranging from flood prediction and urban planning to video game design and archaeology. But what is a Digital Elevation Model exactly? In this guide, we’ll demystify DEMs, explore how they are created, and uncover their critical role in helping us understand and interact with the shape of our world. What is a Digital Elevation Model (DEM)?  A Digital Elevation Model (DEM) is a digital representation of the bare-earth terrain, excluding natural and man-made features like trees, buildings, and power lines. Think of it as a “bald earth” model. It represents the ground surface at a specific resolution, where each pixel in the dataset holds a value representing its elevation above a fixed datum (usually sea level). DEM vs. DTM vs. DSM: Untangling the Acronyms This is a common point of confusion. Understanding the difference is crucial to using the right data for your project. Digital Elevation Model (DEM): This is often used as a catch-all term, but technically, it’s a subset of the DTM. A DEM is a raster grid of uniform, spaced elevation points. Digital Terrain Model (DTM): This represents the bare-earth surface and includes breaklines—features that define the terrain’s shape, like ridges, valleys, and coastlines. In many contexts, especially in the US, DEM and DTM are used interchangeably, but a DTM can be more detailed. Digital Surface Model (DSM): This represents the top of all surface features, including buildings, vegetation, and power lines. It’s what you would see if you could “lift off” the top of the world. The Simple Analogy: DSM: The top of a forest’s canopy. DEM/DTM: The forest floor. How Are Digital Elevation Models Created? DEMs can be generated through several advanced technologies, each with its own pros and cons. 1. Remote Sensing (The Most Common Methods) Satellite-Based Radar (InSAR): Satellites like the SRTM (Shuttle Radar Topography Mission) and TanDEM-X use radar to measure the distance between the satellite and the ground. By comparing multiple radar images, they can generate a highly accurate global DEM. This is the source for much of the free, medium-resolution DEM data available today. Optical Stereoscopy: This method works like how our eyes perceive depth. Satellites (like ASTER or WorldView) or aircraft capture two or more images of the same area from different angles. By analyzing the parallax difference between these images, elevation can be calculated. This is how the ASTER GDEM was created. LiDAR (Light Detection and Ranging): This is the gold standard for high-resolution elevation data. An aircraft-mounted LiDAR sensor fires rapid laser pulses at the ground. By measuring the time it takes for each pulse to return, it can calculate precise distances. LiDAR directly produces a DSM, but through complex filtering, the points reflected from the ground can be isolated to create an extremely accurate DEM. 2. Traditional Surveying While less common for large areas today, traditional land surveying with GPS and total stations is still used for creating highly precise DEMs for small-scale engineering projects. Key Characteristics of a DEM When choosing a DEM for your project, you need to consider these three critical properties: Resolution: This refers to the ground distance represented by each pixel (the cell size). Low Resolution (e.g., 30-90 meters): SRTM (30m/90m), ASTER GDEM (30m). Best for regional or continental-scale analysis. Medium Resolution (e.g., 10-30 meters): ALOS PALSAR (12.5m). Good for watershed analysis. High Resolution (e.g., 1-5 meters): USGS 3DEP LiDAR (1m), EU Copernicus DEM. Essential for detailed urban planning or engineering. Accuracy (Vertical/Horizontal): How close the elevation values are to the true ground height. High-accuracy LiDAR DEMs can have vertical accuracies of 10-15 centimeters. Data Format: DEMs are most commonly distributed as raster files (like GeoTIFF), where each pixel’s value is its elevation. Read Also: ArcGIS Pro vs. QGIS: The Ultimate 2025 Showdown (Pros, Cons & Verdict) Multispectral vs. Hyperspectral Imagery: A Clear-Cut Guide For 2025 The Power of DEMs: Essential Applications The true value of a DEM is unlocked through spatial analysis. Here are the most common and critical applications: 1. Hydrology and Watershed Analysis (The #1 Use Case) DEMs are indispensable for understanding water flow. Delineating Watersheds: By analyzing flow direction from every cell, a DEM can automatically map the entire area that drains into a specific river or lake. Modeling Flood Inundation: Hydrologists use DEMs to simulate how water will spread across a landscape during a flood event, which is critical for risk assessment and insurance mapping. Creating Stream Networks: By following the path of steepest descent, a DEM can derive where rivers and streams are likely to flow, even if they aren’t mapped. 2. Creating Terrain Visualizations Hillshades: By simulating the sun’s angle, a DEM can create a realistic shaded relief map, making terrain features pop out. Slope and Aspect Maps: These are direct derivatives of a DEM. Slope indicates the steepness (crucial for landslide risk), and Aspect shows the direction a slope faces (important for agriculture and solar panel placement). 3D Fly-throughs: DEMs provide the base terrain for creating immersive 3D visualizations in GIS software and game engines. 3. Engineering and Planning Site Selection: For construction, roads, or infrastructure, planners use DEMs to find the flattest, most stable land. Cut-and-Fill Calculations: DEMs are used to calculate the volume of earth that needs to be moved (cut) or added (fill) to level a construction site. Line of Sight Analysis: Used for planning telecommunications towers, wind farms, and military operations to determine what is visible from a given point. 4. Environmental and Geological Applications Landslide Risk Modeling: By combining slope data from a DEM with geological information, scientists can identify areas prone to landslides. Glacier and Coastal Monitoring: Comparing DEMs from different dates allows scientists to measure glacial retreat and coastal erosion with precision. Where to Find Free DEM Data Sources? Fortunately, a wealth of high-quality DEM data is available for free: USGS EarthExplorer (Global): The … Read more

Multispectral vs. Hyperspectral Imagery: A Clear-Cut Guide For 2025

From monitoring crop health from space to detecting minute mineral deposits from the air, remote sensing allows us to see the world in ways the human eye cannot. This powerful capability hinges on detecting light beyond the visible spectrum. But not all spectral imagery is created equal. The two giants in this field are multispectral imagery and hyperspectral imagery. While they sound similar, the difference between them is not just a matter of degree—it’s a fundamental distinction in data richness and application potential. Understanding this difference is crucial for anyone in fields like agriculture, environmental science, mining, or defense. Let’s break down the “spectral” showdown. The Core Difference: A Simple Analogy Imagine you’re trying to identify a specific shade of blue paint in a hardware store. Multispectral Imaging is like being given four wide paint swatches: Red, Green, Blue, and “Not Visible.” You can tell it’s a blue, but you can’t pinpoint the exact shade (e.g., “Saxony Blue” vs. “Navy Blue”). Hyperspectral Imaging is like being given a paint fan deck with hundreds of contiguous, narrow swatches. You can match the exact shade perfectly, identifying not just “blue,” but the specific pigment and brand. This is the essence of the difference: Breadth vs. Detail. Head-to-Head: The Technical Breakdown Feature Multispectral Imagery (MSI) Hyperspectral Imagery (HSI) Spectral Bands 3 – 15 broad, discrete bands 100 – 400+ narrow, contiguous bands Spectral Resolution Low (e.g., 70-400 nm bandwidth) Very High (e.g., 5-10 nm bandwidth) Data Delivered A single data value for a wide range of wavelengths per band. A near-continuous spectral signature for each pixel. Data Volume & Cost Lower data volume, more cost-effective Very high data volume, complex processing, more expensive Common Platforms Satellites (Landsat, Sentinel, Planet), drones Specialized airborne sensors, drones, lab equipment Primary Strength Broad classification and monitoring Detailed identification and quantification of materials   Diving Deeper: What Are Spectral Signatures? The true power of hyperspectral imagery lies in its ability to detect detailed spectral signatures. Every material on Earth—a leaf, a mineral, a type of asphalt—absorbs and reflects light in a unique way across the electromagnetic spectrum. This unique pattern is its spectral signature, like a chemical fingerprint. (Image Suggestion: A graph showing the spectral signatures of healthy vegetation, dry soil, and water. Highlight how they have distinct absorption and reflectance patterns.) Alt Text: Graph showing the unique spectral reflectance signatures of vegetation, soil, and water. Multispectral can see general shapes of these signatures. It can tell you that a pixel is “probably vegetation” because it has high reflectance in the Near-Infrared (NIR) band. Hyperspectral sees the exact shape of the signature. It can tell you the vegetation is a corn plant suffering from nitrogen deficiency because it detects subtle absorption features in the red-edge spectrum that are invisible to multispectral sensors. Read Also: ArcGIS Pro vs. QGIS: The Ultimate 2025 Showdown (Pros, Cons & Verdict) What is a TIN (Triangulated Irregular Network)? How to Use QGIS for Precision Farming: A Beginner’s Guide [2025] When to Use Which? A Practical Application Guide Use Multispectral Imagery For: Land Cover Classification: Mapping broad categories like urban, forest, agriculture, and water. Vegetation Health (NDVI): Using indices like NDVI to monitor large-scale crop health or forest stress. Change Detection: Monitoring urban sprawl, deforestation, or glacier retreat over time. Water Body Mapping: Delineating lakes, rivers, and coastlines. Multispectral is your reliable, cost-effective workhorse for large-area studies and routine monitoring. Use Hyperspectral Imagery For: Mineral Exploration & Geology: Identifying specific mineralogy (e.g., clays, carbonates, ore minerals) based on their precise spectral fingerprints. This is one of its most powerful applications. Precision Agriculture: Differentiating between crop types and detecting specific nutrient deficiencies, water stress, or disease outbreaks before they are visible to the eye or to multispectral sensors. Environmental Monitoring: Detecting and quantifying specific pollutants in soil or water, such as oil spills or chemical plumes. Defense & Intelligence: Identifying camouflaged objects or classifying specific man-made materials. Hyperspectral is your specialist tool for when you need to know the specific “what,” not just the general “where.” The Trade-Offs: It’s Not All Black and White Choosing between MSI and HSI involves balancing several factors: Cost & Accessibility: Multispectral data is widely available from free satellite sources (Landsat, Sentinel) and affordable drones. Hyperspectral data collection is significantly more expensive and requires specialized, often airborne, sensors. Data Volume & Processing: A single hyperspectral flight can generate terabytes of data, requiring sophisticated software and powerful computing resources for processing and analysis. Multispectral data is far more manageable. The “Curse of Dimensionality”: With hundreds of bands, hyperspectral data can lead to analysis challenges where the sheer volume of information makes it difficult to extract meaningful patterns without advanced statistical techniques. Conclusion: Multispectral vs. Hyperspectral Imagery The choice between multispectral and hyperspectral imagery isn’t about one being “better” than the other. It’s about selecting the right tool for your specific question, budget, and scale. Start with Multispectral. If you need to answer broad “what and where” questions over large areas, multispectral imagery is almost always the most practical and cost-effective starting point. Upgrade to Hyperspectral. When your project demands detailed, material-specific answers—like identifying a particular mineral or diagnosing a specific plant disease—the investment in hyperspectral imagery becomes not just useful, but essential. As processing power increases and costs decrease, the line between these technologies will continue to blur. But for now, understanding their fundamental differences empowers you to see our world with the right kind of vision. FAQ: Multispectral vs. Hyperspectral Imagery Q: Can you get hyperspectral data from satellites? A: Yes, but it’s less common. Dedicated hyperspectral satellites like NASA’s EMIT and ESA’s PRISMA are operational, but the data is not as ubiquitous as multispectral data from Landsat or Sentinel. Q: Is hyperspectral imagery just higher resolution multispectral? A: No. This is a common misconception. The difference is spectral resolution (number and narrowness of bands), not spatial resolution (pixel size). You can have high-spatial-resolution multispectral data and low-spatial-resolution hyperspectral data. Q: What software is used to analyze hyperspectral data? A: It requires specialized software like ENVI, which has robust tools for handling and analyzing large hyperspectral cubes, alongside open-source options in Python (e.g., scikit-learn, Spectral Python). Q: For precision agriculture, is hyperspectral always better? A: Not always. Multispectral is often sufficient for general … Read more

ArcGIS Pro vs. QGIS: The Ultimate 2025 Showdown (Pros, Cons & Verdict)

ArcGIS pro vs. Qgis

If you’re stepping into the world of Geographic Information Systems (GIS), one question inevitably arises: Should I use ArcGIS Pro or QGIS? This isn’t just a choice of software; it’s a choice of ecosystem, philosophy, and budget. On one side, you have ArcGIS Pro, the powerful, industry-standard suite from Esri, known for its seamless integration and enterprise strength. On the other, you have QGIS, the robust, open-source champion that is both free and incredibly powerful. This isn’t about declaring one the “winner.” It’s about answering a more important question: Which GIS software is right for YOU? Let’s break down this great GIS debate. ArcGIS Pro vs. QGIS at a Glance Feature ArcGIS Pro QGIS Cost Commercial License ($$$) Free & Open-Source ( $0 ) Learning Curve Steeper, structured Gentler, more flexible Ecosystem & Integration Excellent (ArcGIS Online, Enterprise) Good (relies on plugins & external data) Core Functionality Very Strong Very Strong Advanced & Niche Tools Included (e.g., 3D, Spatial Analytics) Available via Plugins Customization & Scripting Python (ArcPy), ArcGIS API for Python Python (PyQGIS), R, C++ Best For Large Enterprises, Government, Seamless Workflows Students, Consultants, Researchers, Budget-Conscious Users   The Deep Dive: Breaking Down the Key Factors 1. Cost: The Biggest Differentiator QGIS: This is the most significant advantage. QGIS is completely free. You can download, install, and use it for any purpose—personal, academic, or commercial—without ever paying a cent. There are no hidden fees or subscription tiers. ArcGIS Pro: Operates on a proprietary licensing model. It’s typically sold as part of an Esri ArcGIS Online subscription. Costs can range from $500 to $2,000+ per user, per year, depending on the license level and organizational agreement. While expensive for individuals, this cost often includes access to the entire ArcGIS ecosystem (Online, Living Atlas, etc.). Verdict: If budget is your primary concern, QGIS is the undisputed champion. 2. User Interface & Learning Curve QGIS: Known for its logical, if sometimes slightly dated, interface. It’s highly customizable, allowing you to arrange toolbars to your liking. The learning curve is considered gentler for beginners because you can immediately start using powerful tools without a financial commitment. The menus are straightforward, making it easier to discover functionality. ArcGIS Pro: Features a modern, ribbon-based interface (similar to Microsoft Office). It’s sleek and well-organized but can feel overwhelming initially. The learning curve is steeper, not just because of the interface, but because it’s part of a vast ecosystem. Understanding how Pro connects to Portal and ArcGIS Online is part of the process. Verdict: QGIS is easier to pick up. ArcGIS Pro has a more modern UI but a steeper learning curve due to its extensive ecosystem. 3. Core Functionality & Advanced Tools For 90% of common GIS tasks—digitizing, basic spatial analysis, geoprocessing, and map production—both platforms are exceptionally capable. ArcGIS Pro: Where it pulls ahead is in integrated advanced capabilities. Tools for 3D analytics (ArcGIS Scene), deep machine learning, real-time data processing, and sophisticated spatial statistics (Spatial Analyst extension) are built directly into the platform and work seamlessly together. QGIS: Its power is modular. Through its incredible plugin ecosystem (via the Official QGIS Repository and third-party sources), you can add almost any functionality imaginable. Plugins like Processing NextGen (for model building), Semi-Automatic Classification Plugin (for remote sensing), and MMQGIS (for geocoding) make it a powerhouse. However, you are responsible for finding, installing, and maintaining these plugins. Verdict: For out-of-the-box, seamless advanced analytics, ArcGIS Pro leads. For customizable power through plugins, QGIS is incredible. Read Also: How to Use QGIS for Precision Farming: A Beginner’s Guide [2025] How to Create an Unsupervised Classification Map in ENVI: Complete Step-by-Step Guide 2025 Land Suitability Analysis for Agriculture Using GIS: Methods & Case Studies [2025] 4. Data Ecosystem & Integration ArcGIS Pro: This is Esri’s “walled garden,” and it’s a beautiful one. It integrates flawlessly with ArcGIS Online and ArcGIS Enterprise. This gives you instant access to Living Atlas of the World (a massive collection of authoritative maps and data), easy web map publishing, and powerful collaboration tools across an organization. It’s the complete package. QGIS: It is a “gateway” to the open-source geospatial world. It connects effortlessly to countless data sources (WMS, WFS, PostGIS databases, etc.). However, it doesn’t come with a pre-packaged data library. You are the curator of your own data universe. Verdict: ArcGIS Pro offers a seamless, integrated ecosystem. QGIS offers unparalleled flexibility in a multi-source world. 5. Support & Community QGIS: Relies on community support. This includes official documentation, Stack Exchange, and user forums. The community is vast, passionate, and incredibly helpful. However, there is no official phone number to call for help. ArcGIS Pro: Comes with official, paid support from Esri. This includes technical support, extensive training modules (Esri Academy), and a vast knowledge base. For large organizations, this enterprise-level support is non-negotiable. Verdict: Need guaranteed, professional support? Choose ArcGIS Pro. Prefer a passionate, global community? QGIS has you covered. Who Should Choose Which? A Clear Guide Choose ArcGIS Pro if: You work in a large organization (government, corporation) that already uses the Esri ecosystem. Your workflow heavily relies on ArcGIS Online/Enterprise for sharing and collaboration. You need seamless, out-of-the-box advanced analytics and 3D capabilities. Your projects require official technical support and guaranteed uptime. Budget is not the primary constraint. Choose QGIS if: You are a student, hobbyist, consultant, or researcher on a budget. You value open-source philosophy and want to avoid vendor lock-in. You enjoy tinkering, customizing, and building your perfect GIS toolkit with plugins. Your work involves connecting to a wide variety of open data standards and databases. You are just starting your GIS journey and want to learn without a financial barrier. The Final Verdict: It’s Not a War, It’s a Toolkit The truth is, many professional GIS users don’t choose one exclusively. They use both. A common workflow is to use QGIS for quick data inspection, cleaning, and for accessing specialized open-source tools, and then use ArcGIS Pro for enterprise-level sharing, advanced Esri-specific analytics, and web map publishing. Still unsure? Here’s the simplest way to decide: Download QGIS first. It’s free. Spend a month with it. Complete a project. You will learn the fundamental concepts of GIS without any cost. If you then find yourself needing the integrated ecosystem, collaborative features, or specific advanced tools that only Esri provides, then you can confidently make the business case for investing in ArcGIS Pro. Ultimately, the “right” software is … Read more

What is a TIN (Triangulated Irregular Network)?

3D TIN model representing a mountainous terrain with triangular facets.

In the world of Geographic Information Systems (GIS), representing our three-dimensional Earth on a two-dimensional screen is a constant challenge. For decades, the raster grid—a neat matrix of pixels, each with an elevation value—has been a standard method for creating digital elevation models (DEMs). But what if the terrain is complex, with steep cliffs and gentle plains? Using a uniform grid can be inefficient, forcing simple areas to have the same high resolution as complex ones. This is where the Triangulated Irregular Network, or TIN, offers a smarter, more elegant solution. But what is a TIN? In essence, a TIN is a vector-based representation of a terrain surface, constructed from irregularly spaced points connected by a network of triangles. This post will demystify the TIN data structure, explore how it works, and highlight why it remains a crucial dataset for terrain analysis. What is a Triangulated Irregular Network (TIN)?  Let’s break down the name to understand what a TIN is: Triangulated: The surface is composed entirely of triangles. Triangles are the simplest geometric shape and are guaranteed to be planar (flat), which makes mathematical calculations consistent. Irregular: The points used to create the triangles are not spaced at regular intervals. Instead, they are placed strategically to capture the most important variations in the landscape. Network: These triangles aren’t isolated; they are connected edge-to-edge, forming a continuous, seamless mesh that represents the entire surface. Think of it like a sculptor’s armature. The irregularly spaced points are the key vertices of the sculpture, and the triangles are the wire mesh stretched between them, defining the shape of the final form—in this case, the terrain.   The Building Blocks of a TIN: Nodes, Edges, and Faces To truly grasp how a TIN works, you need to understand its core components: Nodes (Vertices): These are the fundamental data points of the TIN. Each node has an X, Y, and Z (elevation) coordinate. They are placed at critical locations like mountain peaks, pit bottoms, along ridge lines, and stream channels to capture the essence of the topography. Edges: These are the lines connecting the nodes. The most important edges are the triangle sides. Faces: The triangular facets formed by three edges and three nodes. Each triangular face defines a small, planar section of the terrain. The true intelligence of a TIN lies in how these nodes are connected. This is determined by a mathematical principle called Delaunay Triangulation. The Magic Behind the Mesh: Delaunay Triangulation Delaunay Triangulation is the most common algorithm for connecting the dots in a TIN. It follows a key rule: for any triangle, the circle that passes through its three points (the circumcircle) should not contain any other node. Why is this important? This rule ensures that the triangles are as “equi-angular” as possible, avoiding long, skinny triangles. This results in a more accurate and numerically stable surface model, which is critical for reliable slope, aspect, and volume calculations. TIN vs. Raster DEM: Both TINs and raster DEMs model elevation, but they do so in fundamentally different ways. Understanding the difference is key to choosing the right tool for your GIS project. Feature TIN (Vector-Based) Raster DEM (Grid-Based) Data Structure Irregular triangles Regular grid of square cells Storage Efficiency More efficient for complex terrain. Uses fewer points in simple areas and more in complex areas. Less efficient. Simple and complex areas are sampled at the same resolution. Representation of Features Excellent. Can precisely model hard breaklines like cliffs, ridges, and streams. Poor. Breaklines are “stair-stepped” and smoothed over, losing precision. Calculation Speed Slower for some analyses due to complex data structure. Faster for many analyses due to simple, uniform cell structure. Best For Engineering design, volume calculations, precise feature mapping, and visualizing complex geology. Landscape-scale analysis, hydrological modeling, and broad-scale viewshed analysis. The key takeaway: Use a TIN when you need precision, have linear features, or want an efficient model for highly variable terrain. Use a raster DEM for broader analyses where processing speed and simplicity are prioritized. 👉 Raster Vs. Vector Data Where are TINs Used? Real-World Applications The unique advantages of the TIN data structure make it indispensable in several fields: Civil Engineering and Construction: TINs are the standard for calculating cut-and-fill volumes for site development, road design, and quarry operations. Their ability to model precise surfaces is crucial for earthwork calculations. 3D Visualization and Film: The efficient structure of a TIN makes it ideal for creating realistic, high-detail 3D terrain models for visual effects, simulations, and gaming environments. Floodplain Mapping and Hydrology: By incorporating breaklines along stream channels and levees, TINs can create highly accurate models to predict water flow and flood inundation extents. Geology and Mining: Geologists use TINs to model the complex surfaces of geological strata, ore bodies, and open-pit mines, enabling precise volume estimations. Landscape Architecture and Urban Planning: TINs help designers create accurate models of existing sites, allowing them to visualize and plan new developments in context with the actual terrain. The Advantages and Limitations of TINs Advantages: Adaptive Resolution: Provides high detail where needed (complex terrain) and lower detail in simple areas, leading to smaller file sizes for the same effective accuracy. Precision with Breaklines: Can incorporate “hard” and “soft” breaklines to enforce linear features like roads, ridges, and streams, which raster models cannot do accurately. True 3D Features: Can model true 3D objects like overhangs and tunnels (though this requires specialized software and more complex data structures). Limitations: Complex Data Structure: The irregular topology is more complex to manage and process than a simple raster grid. Computationally Intensive: Some spatial analyses can be slower on a TIN compared to a raster. Not Ideal for All Analyses: It is less suitable for certain types of analyses that are inherently grid-based, like some forms of spatial filtering. Conclusion: While raster DEMs are incredibly useful for a wide array of applications, the Triangulated Irregular Network (TIN) stands out as the intelligent, vector-based alternative for precision terrain modeling. Its ability to efficiently adapt to landscape complexity and accurately represent sharp topographic features makes it an invaluable dataset in engineering, design, and advanced geospatial analysis. By understanding what a TIN is and … Read more