In today’s fast-paced GIS environment, keeping track of the health, performance, and overall efficiency of your Enterprise GIS is critical with ArcGIS Monitor 2024.0.
ArcGIS Monitor has been a trusted solution for administrators, offering detailed metrics that help optimize both GIS and IT investments.
With the release of ArcGIS Monitor 2024.0, Esri has introduced a new, simplified workflow that makes comparing metrics across similar components easier than ever.
Table of Contents
ToggleWhat is ArcGIS Monitor 2024.0?
ArcGIS Monitor 2024.0 is a specialized tool designed to help administrators track and optimize the performance, health, and usage of ArcGIS Enterprise deployments.
It collects real-time metrics on system components like hosts, ArcGIS Server sites, and web services, allowing administrators to monitor performance, prevent downtime, and improve system efficiency.
The 2024.0 version introduces new workflows, such as the ability to compare metrics between similar components, providing a streamlined process for analyzing and maintaining the health of GIS infrastructure.
What’s New in ArcGIS Monitor 2024.0?
The latest release introduces a powerful feature allowing users to compare metrics of similar components—such as hosts, ArcGIS Server sites, or web services—with just a few clicks.
This eliminates the need for manually configuring new dataview queries, streamlining the process and making it more accessible to both seasoned and novice administrators.
Here’s a step-by-step guide to using this new feature:
7 powerful features of ArcGIS Monitor 2024.0
1. Effortless Metric Comparison
The new workflow allows you to quickly compare metrics between similar components like hosts, ArcGIS Server sites, or web services, streamlining performance analysis without needing complex data-view queries.
2. Customizable Analysis Views
You can easily copy the compared metrics to a new or existing analysis view, giving you flexibility to customize and modify metrics to suit your monitoring needs.
3. Enhanced Component Selection
ArcGIS Monitor 2024.0 enables you to select up to 10 components at once for comparison, making it easier to analyze multiple instances of similar components in one go.
4. Reduced System Downtime
By providing quick access to detailed metrics comparisons, administrators can identify performance bottlenecks early, helping to prevent unexpected system downtime and improve overall stability.
5. Simplified Monitoring Interface
The intuitive interface reduces the learning curve for new users, allowing both experienced and novice GIS admins to seamlessly navigate and utilize the tool for efficient monitoring.
6. Real-Time Performance Insights
With real-time data monitoring, ArcGIS Monitor helps ensure that your system’s performance is always up to date, allowing administrators to make informed decisions based on the latest insights.
7. Convenient Licensing via Esri Store
ArcGIS Monitor 2024.0 is now available for purchase online through the Esri Store, making it easier to obtain new licenses or scale up by adding additional cores without any hassle.
Step-by-Step Workflow:
Sign In to ArcGIS Monitor: First, log in to your ArcGIS Monitor dashboard and navigate to the Monitoring tab.
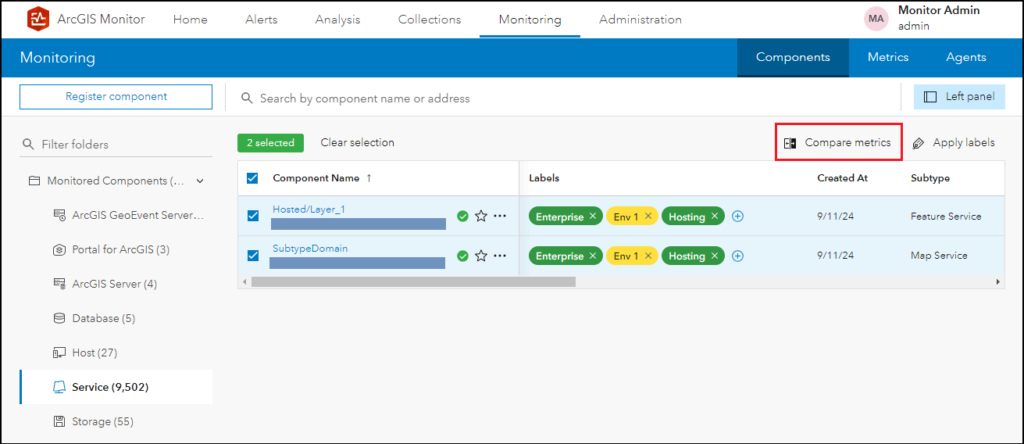
- Select Similar Components: From the component list, select two or more components of the same type (you can choose up to 10). As soon as you select them, you’ll notice a new button called Compare Metrics in the upper-right corner of the component list.

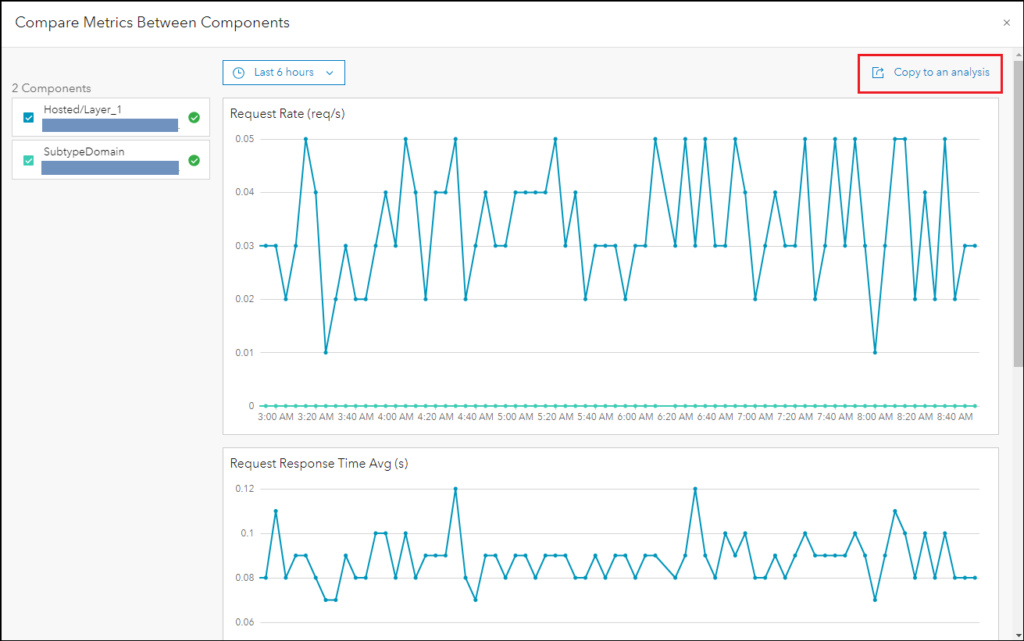
- Compare Metrics: After clicking the Compare Metrics button, a panel will display the selected components on the left, and their respective metrics will be shown on the right. These metrics mirror the ones shown in each component’s overview panel, giving you a side-by-side comparison. You also have the option to remove components from the list if needed.

- Create an Analysis View: If you want to save these comparisons for further analysis, click the Copy to an Analysis button in the upper-right corner. You can either create a new analysis view or add the metrics to an existing one.

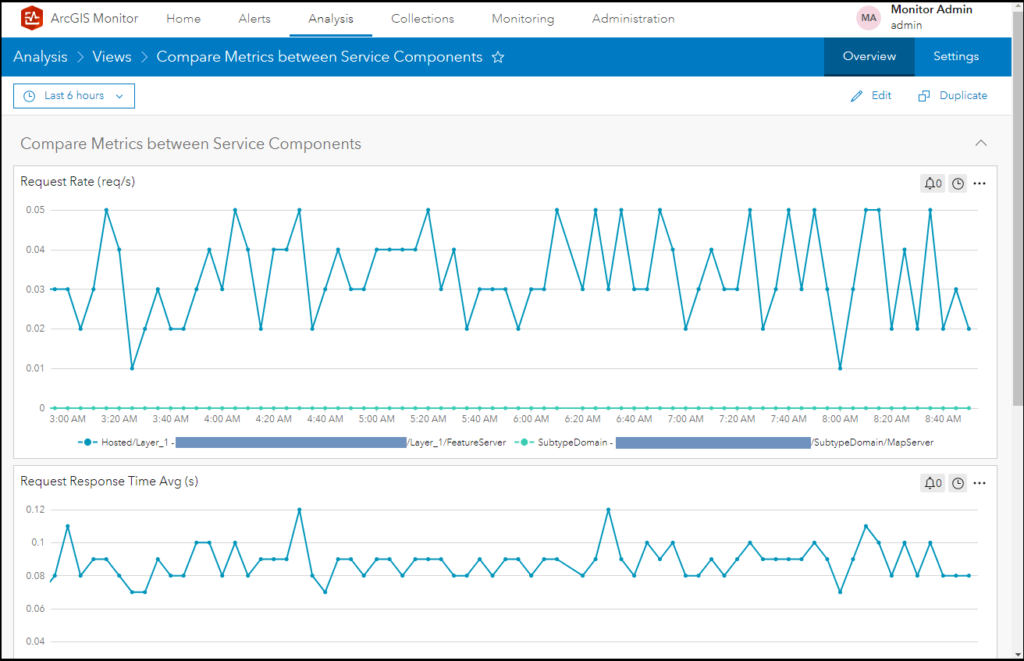
- Modify and Edit Your Analysis: Navigate to the Analysis tab, select your analysis view, and make any modifications as needed. The new metrics are fully customizable, allowing you to adjust them like any other element in the analysis view.
This workflow significantly simplifies the task of comparing metrics across similar components, empowering administrators to quickly spot inefficiencies, performance bottlenecks, or potential downtime risks.
Purchase ArcGIS Monitor from the Esri Store
In another exciting update, ArcGIS Monitor is now available for direct purchase from the Esri Store.
Whether you’re a GIS admin looking to purchase a new Monitor license or a manager looking to scale with additional cores, you can now conveniently shop online.
Conclusion
The 2024.0 update to ArcGIS Monitor is a game-changer for GIS administrators, making it easier to compare and analyze the health of your GIS system.
By introducing features that reduce system downtime and improve overall performance, ArcGIS Monitor continues to be an indispensable tool for any Enterprise GIS deployment.
Be sure to explore these new features and optimize your system’s performance today.
For more insights and updates on GIS technologies, stay tuned to THEGISJOURNAL.COM!
Recent Posts
- The Ethical Frontier: 5 Critical Questions for Using AI in Geomatics
- What is LiDAR? A Simple 2025 Guide to How It Works & Its Uses
- LiDAR vs. Photogrammetry: The Ultimate 2025 Showdown (Pros, Cons & Verdict)
- How Do Drones (UAVs) Collect GIS Data? The Complete 2025 Guide
- 8 Common Map Projections: Which One is Right for Your Map?
